
Now THAT’s what I call a big bounce back! Stocks surged last week as volatility fell, economic data improved, and investors started focusing on a future featuring lower interest rates.
But how far can this rebound go? And what happens next for stocks? THAT’s what I’ll dive into today. Let’s start with the MoneyShow Chart of the Week. It’s a three-month “percent off highs” chart showing how much ground several market benchmarks lost in the early-August selloff...and how much ground they gained back more recently.
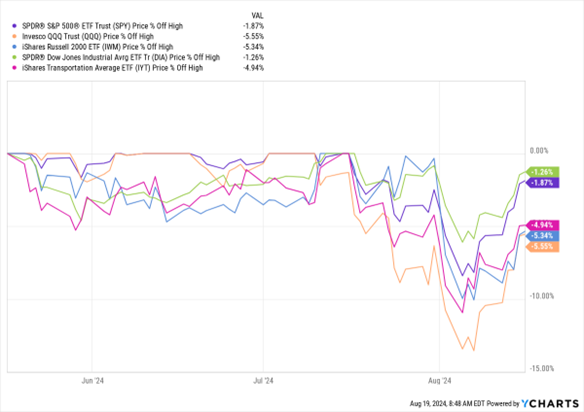
Data by YCharts
You can see the Invesco QQQ Trust (QQQ) tanked more than 10% from its highs earlier this month. The iShares US Transportation ETF (IYT) and iShares Russell 2000 ETF (IWM) both fell by around 10%, while the S&P 500 ETF Trust (SPY) and SPDR Dow Jones Industrial Average ETF (DIA) suffered more muted declines.
You can also see how ETFs that track the S&P 500 and Dow Industrials are now back within spitting distance of their highs – while those tracking tech, transports, and small caps still have some ground to cover. Diving a little deeper, sectors like consumer staples, utilities, and health care are back AT their highs, while financials and real estate almost are. Energy, consumer discretionary, and tech are the standout laggards.
All in all, I’d say the action confirms the “Buy the Dip” mentality hasn’t gone away. It’s just that different sectors and groups are starting to lead. Or in simple terms, I believe it is STILL a bull market where “Be Bold” works as a strategy. You just want to put more money to work in small caps, financials, industrials, materials, and other “non-tech” groups.


