
It finally happened. The S&P 500 suffered its first “2% down day” in 356 days on July 24. The Magnificent Seven stocks shed about $700 billion in market capitalization, while volatility surged and bears came out of the woodwork.
But is there such a thing as a “Big” decline that isn’t “Bad?” I’d argue the answer is “Yes” – and the MoneyShow Chart of the Week for July 29, 2024 explains why...
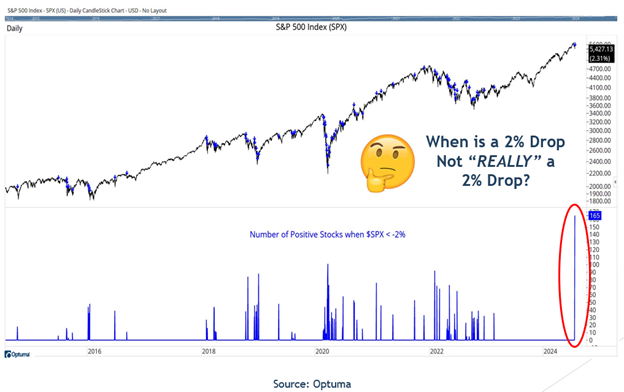
Courtesy of Optuma (with my commentary and emoji added!), it shows that, yes, the S&P got clobbered. But 165 stocks actually closed HIGHER that day. That was the most for any 2%-plus selloff day in at least a decade, with the Covid low of March 2020 the last time we were even close (at 101 stocks).
There are other ways you can illustrate the same point, too. Consider that while the market-cap-weighted S&P 500 ETF Trust (SPY) is roughly flat in the 30 days through last Friday, the Invesco S&P 500 Equal Weight ETF (RSP) is UP around 3.4% during that same stretch.
Meanwhile, the massive market rotation into small caps sent the iShares Russell 2000 ETF (IWM) up more than 12% in that period. Plus, we’ve already regained some of the ground we lost earlier last week!
Bottom line? I remain constructive on this market going forward. The big rotation I wrote about last week is powerful...likely sustainable...and not something you want to fight. Instead, you should capitalize on it by rotating more money into new leaders like financials, industrials, miners, and small caps.
Because in the end, not every BIG decline is all that BAD!


