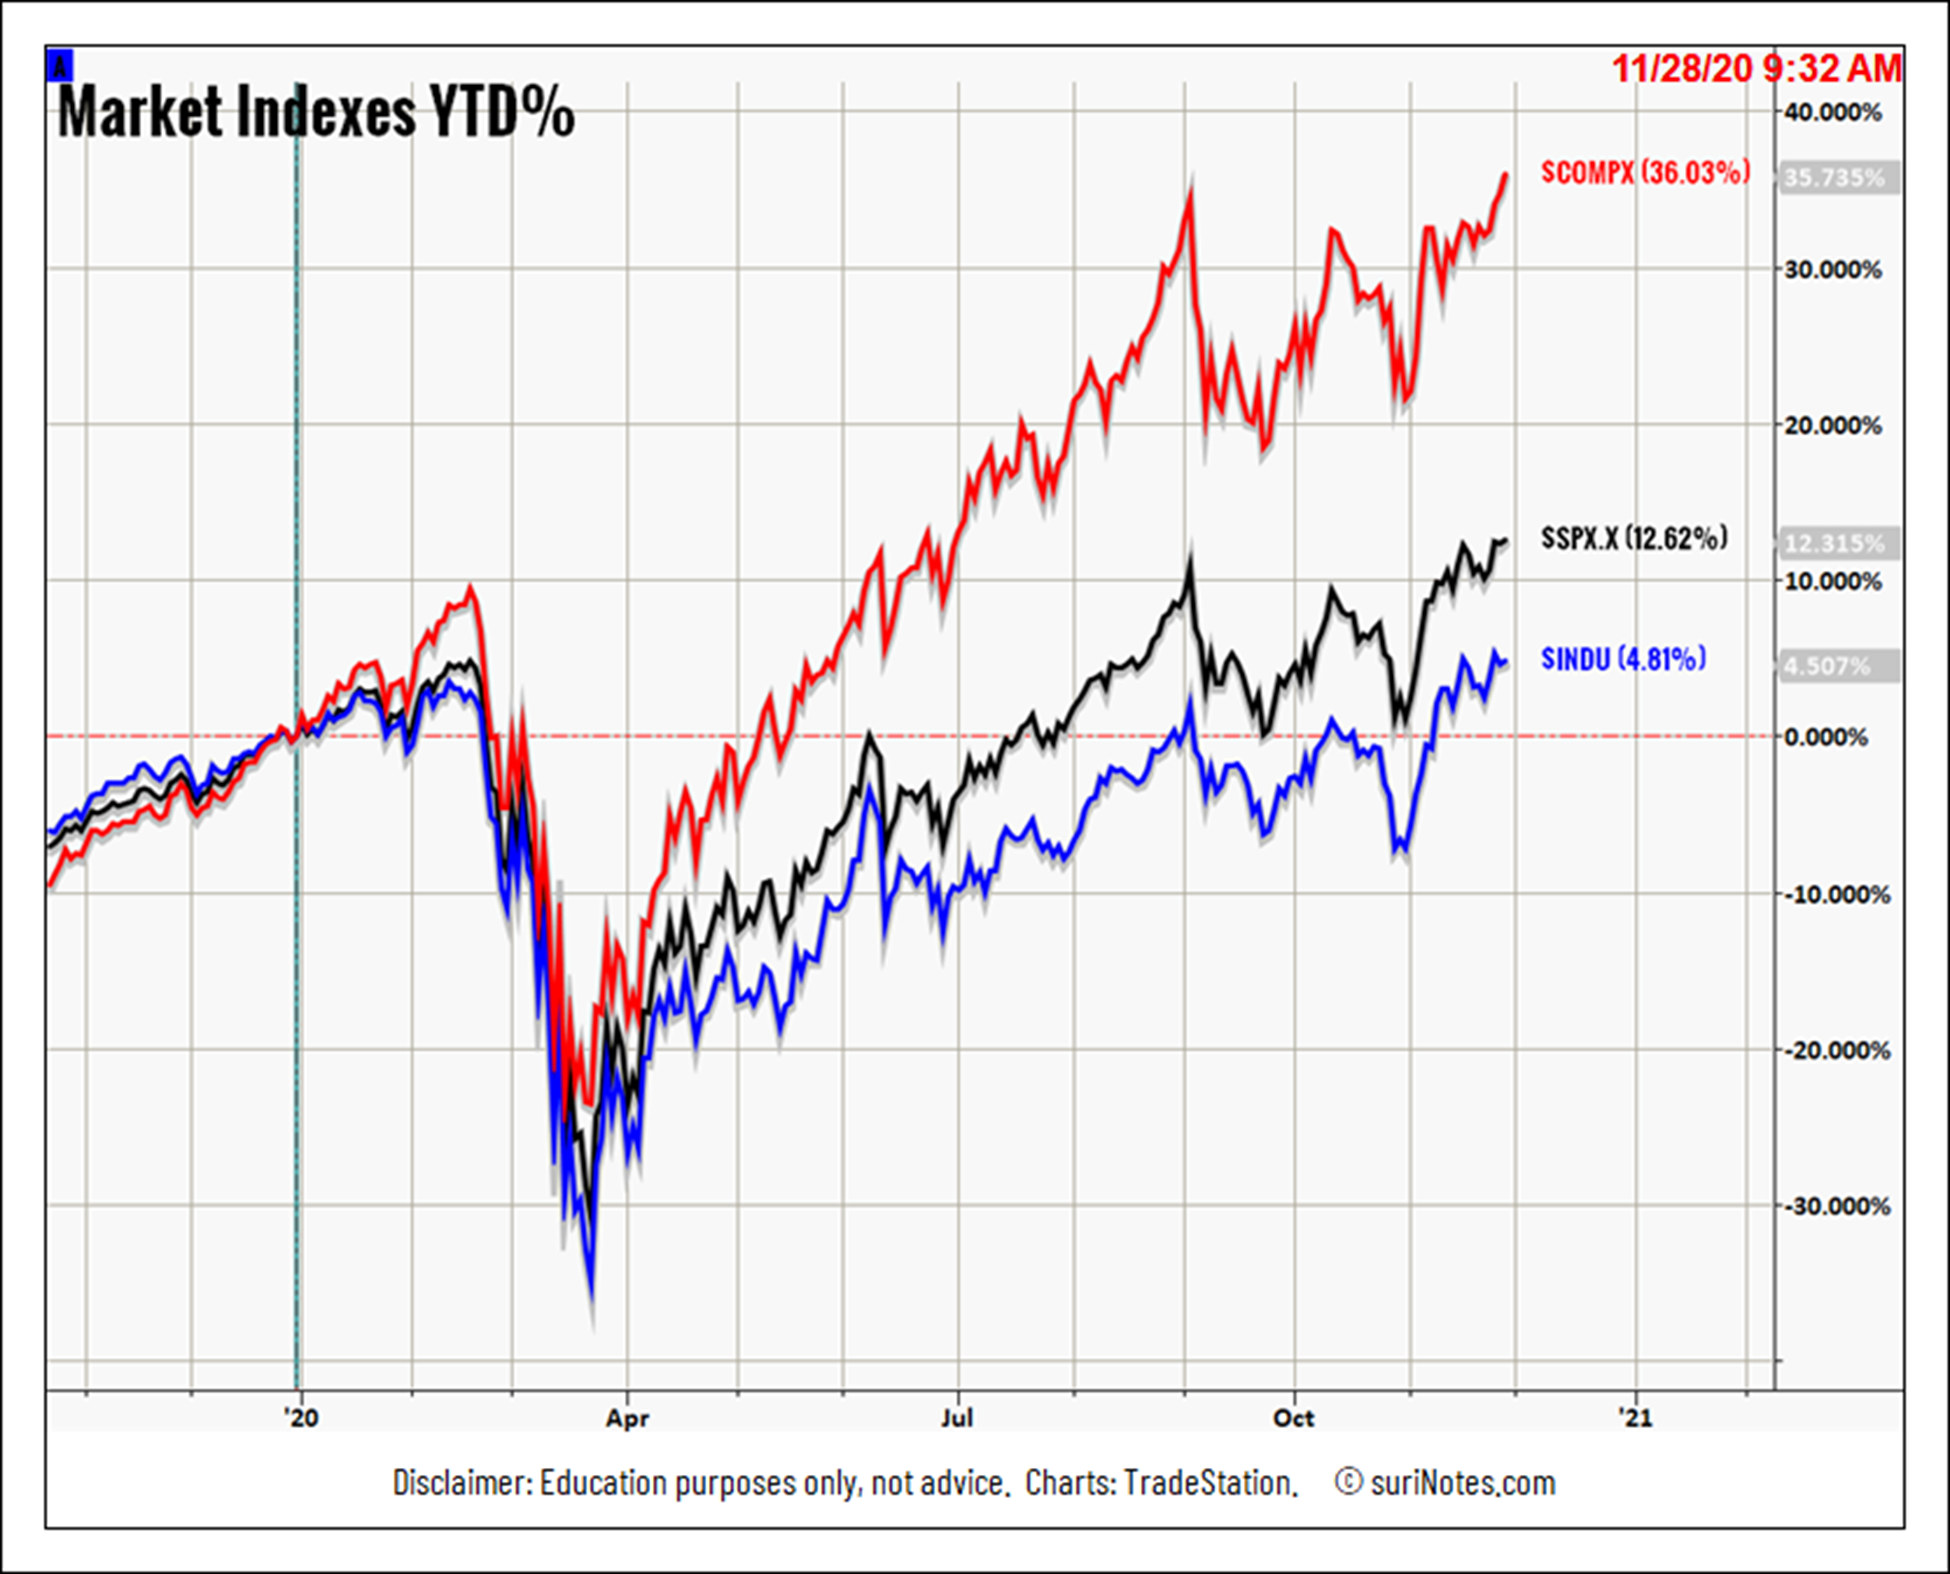
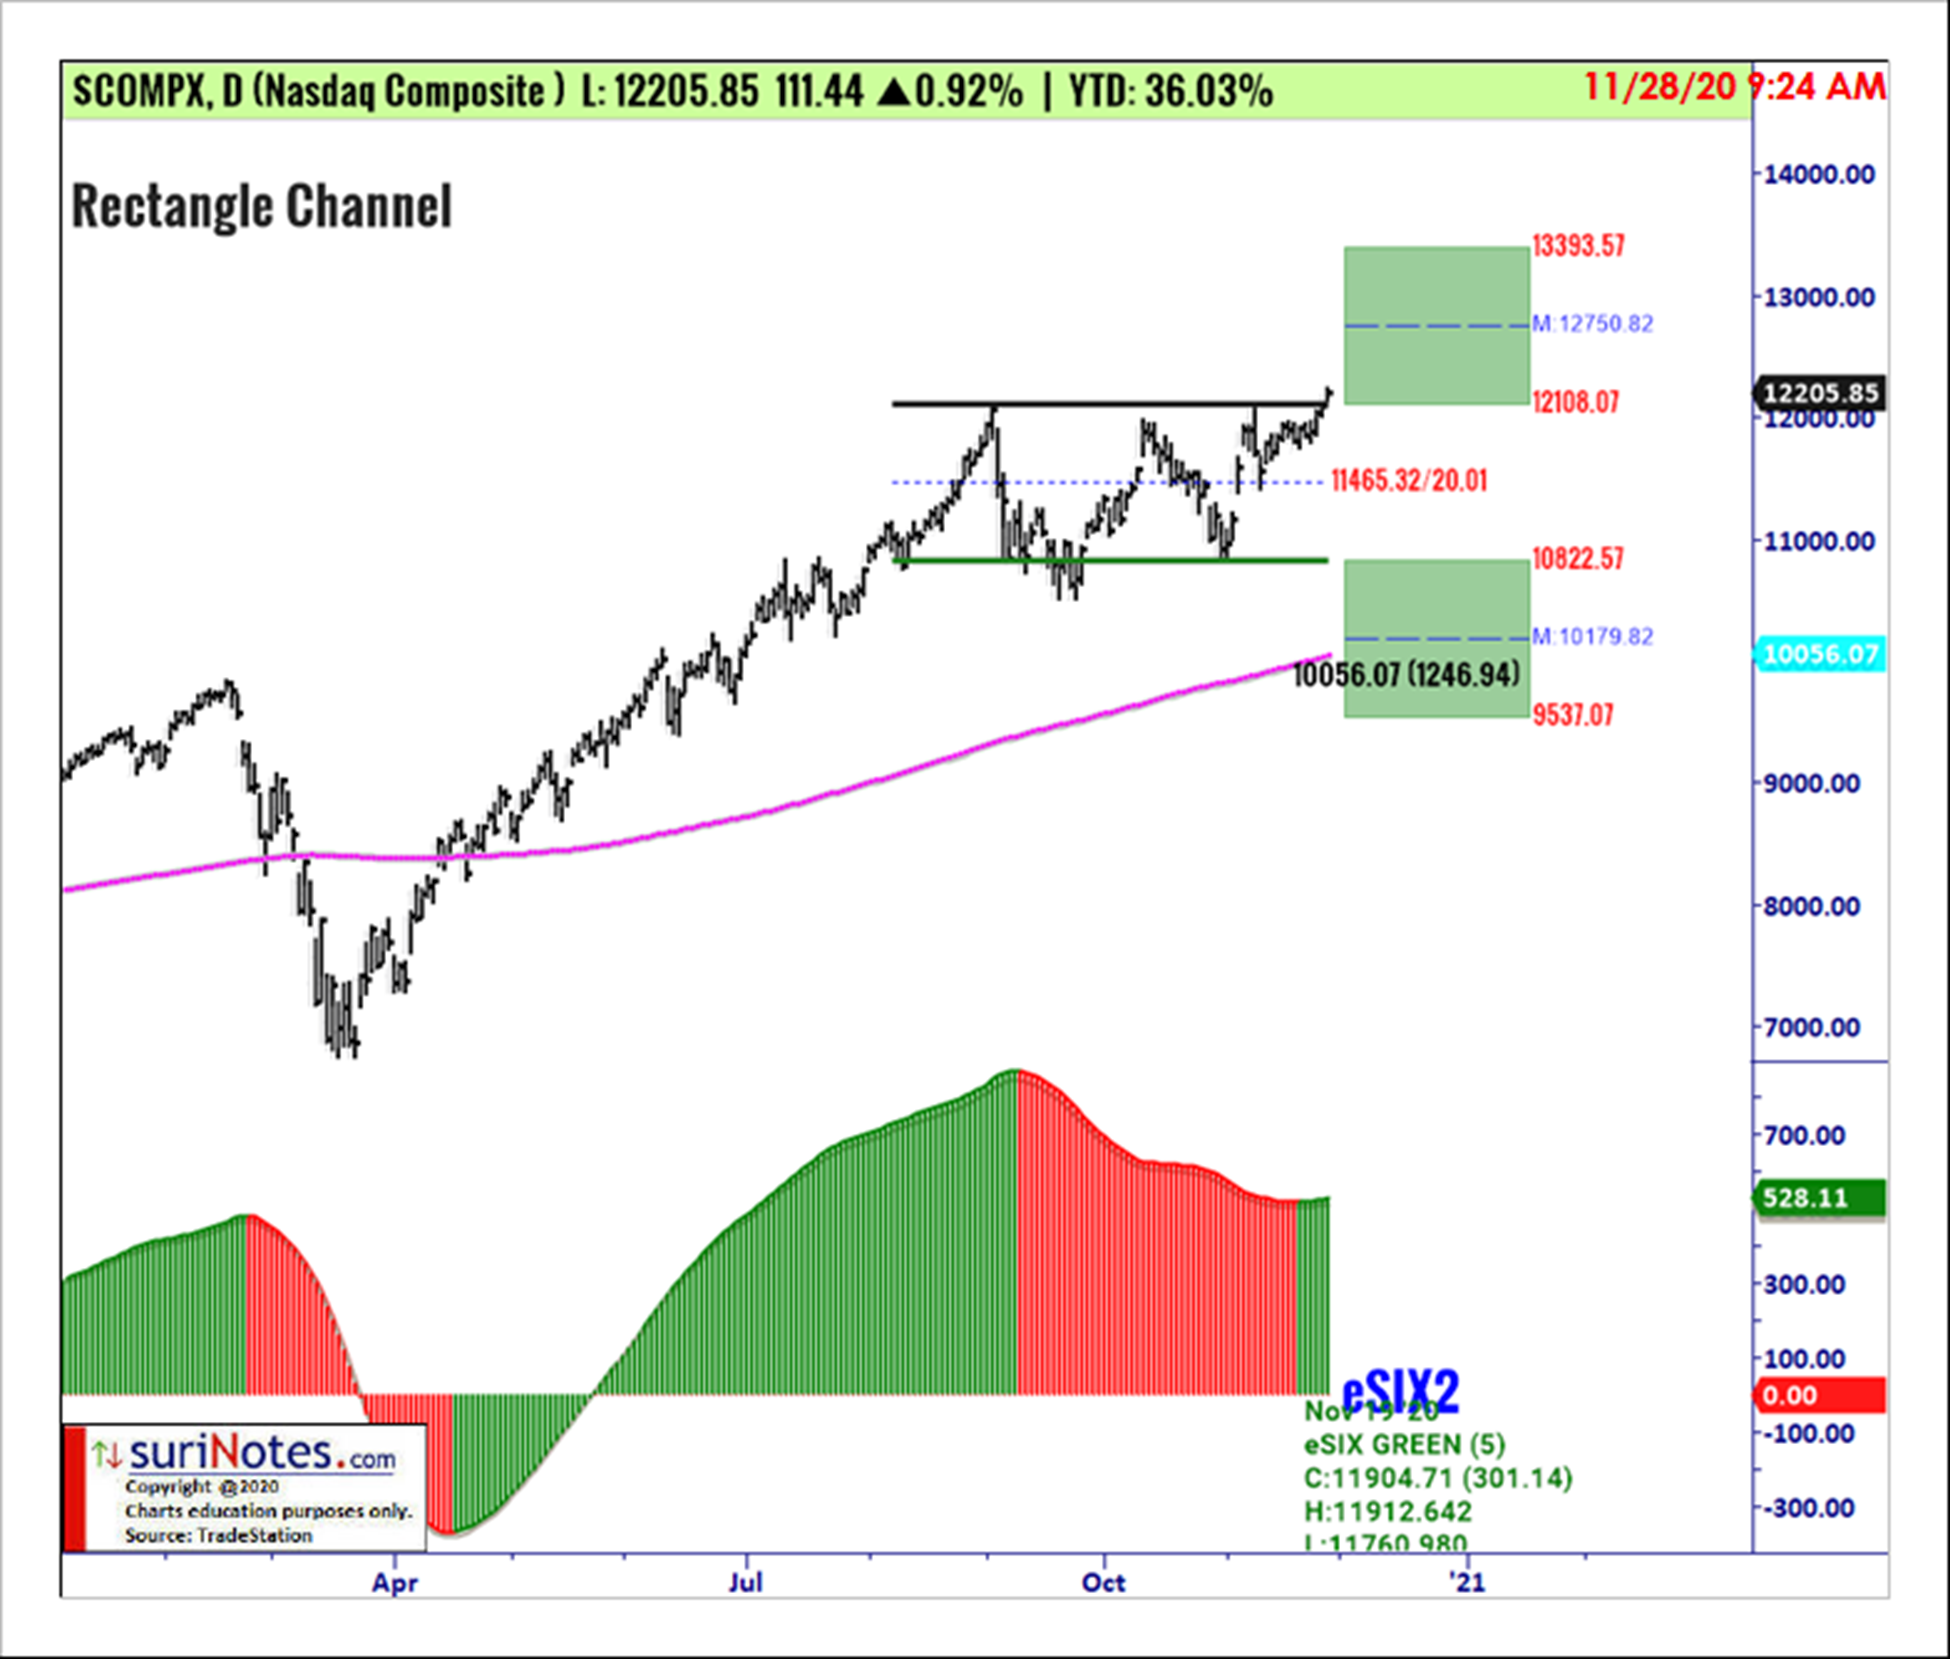
The U.S. markets' major indexes (Dow, S&P, and Nasdaq) have been trading within medium-term rectangle channel chart patterns since August 2020 and appear to be breaking out the channels with positive momentum, states Suri Duddella of suriNotes.com.
Here we present how to trade the rectangle channel breakouts in these indexes.
Major Market Indexes Performances in 2019 and 2020

Major Market Indexes YTD%
Trading Rectangle Channel Patterns
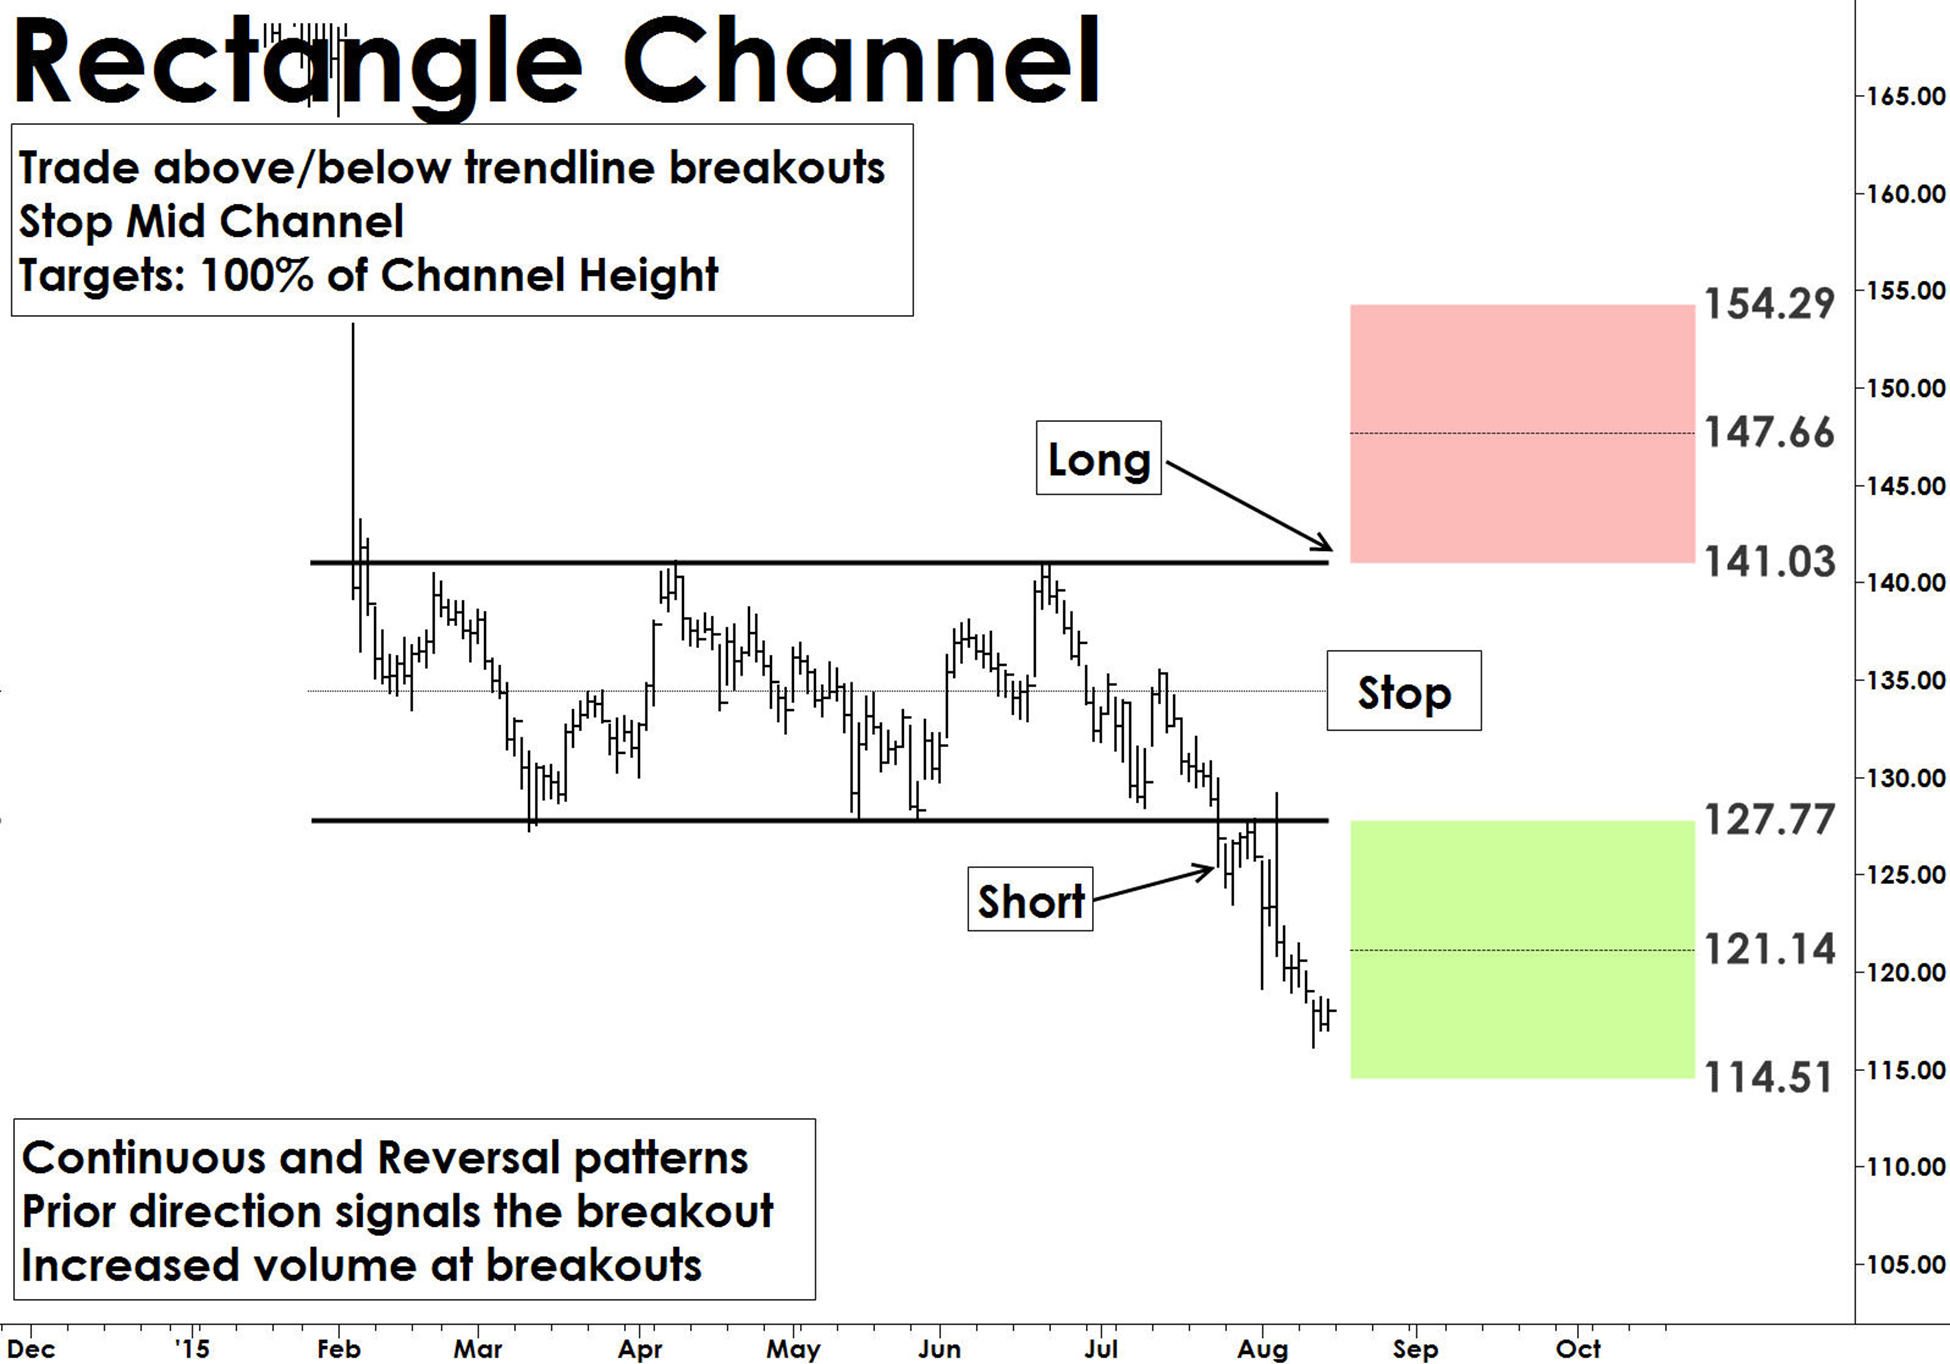
Rectangle channel patterns are formed by price action between two key trendlines bound by multiple equal (near) highs and lows. The duration of the pattern can be few days to months. Longer-duration patterns are considered to be more reliable. The pattern must have at least two pivots (equal highs or equal lows) on each of the trendlines. The price breakout can occur in any direction from the pattern, but the general belief is price may break out in the same direction as prior direction before the pattern formation. The volume inside the pattern is non-decisive, but volume tends to increase during the breakouts.
Trade:
A trade setup occurs when price closes outside the trend line (upper or lower) at least two bars signaling a breakout. Trades are entered on a follow-up bar at high above the breakout bar or low below the breakdown bar.
Target:
Targets in rectangle channel formations are based on the depth of the rectangle pattern. Targets are usually set at 70 to 100% of the depth of rectangle from the trade entry.
Stop:
Rectangle patterns fail when prices retrace into the middle of the rectangle channel. Place a stop order just below the middle of the channel.
S&P 500 Index (SPX) Rectangle Channel Pattern
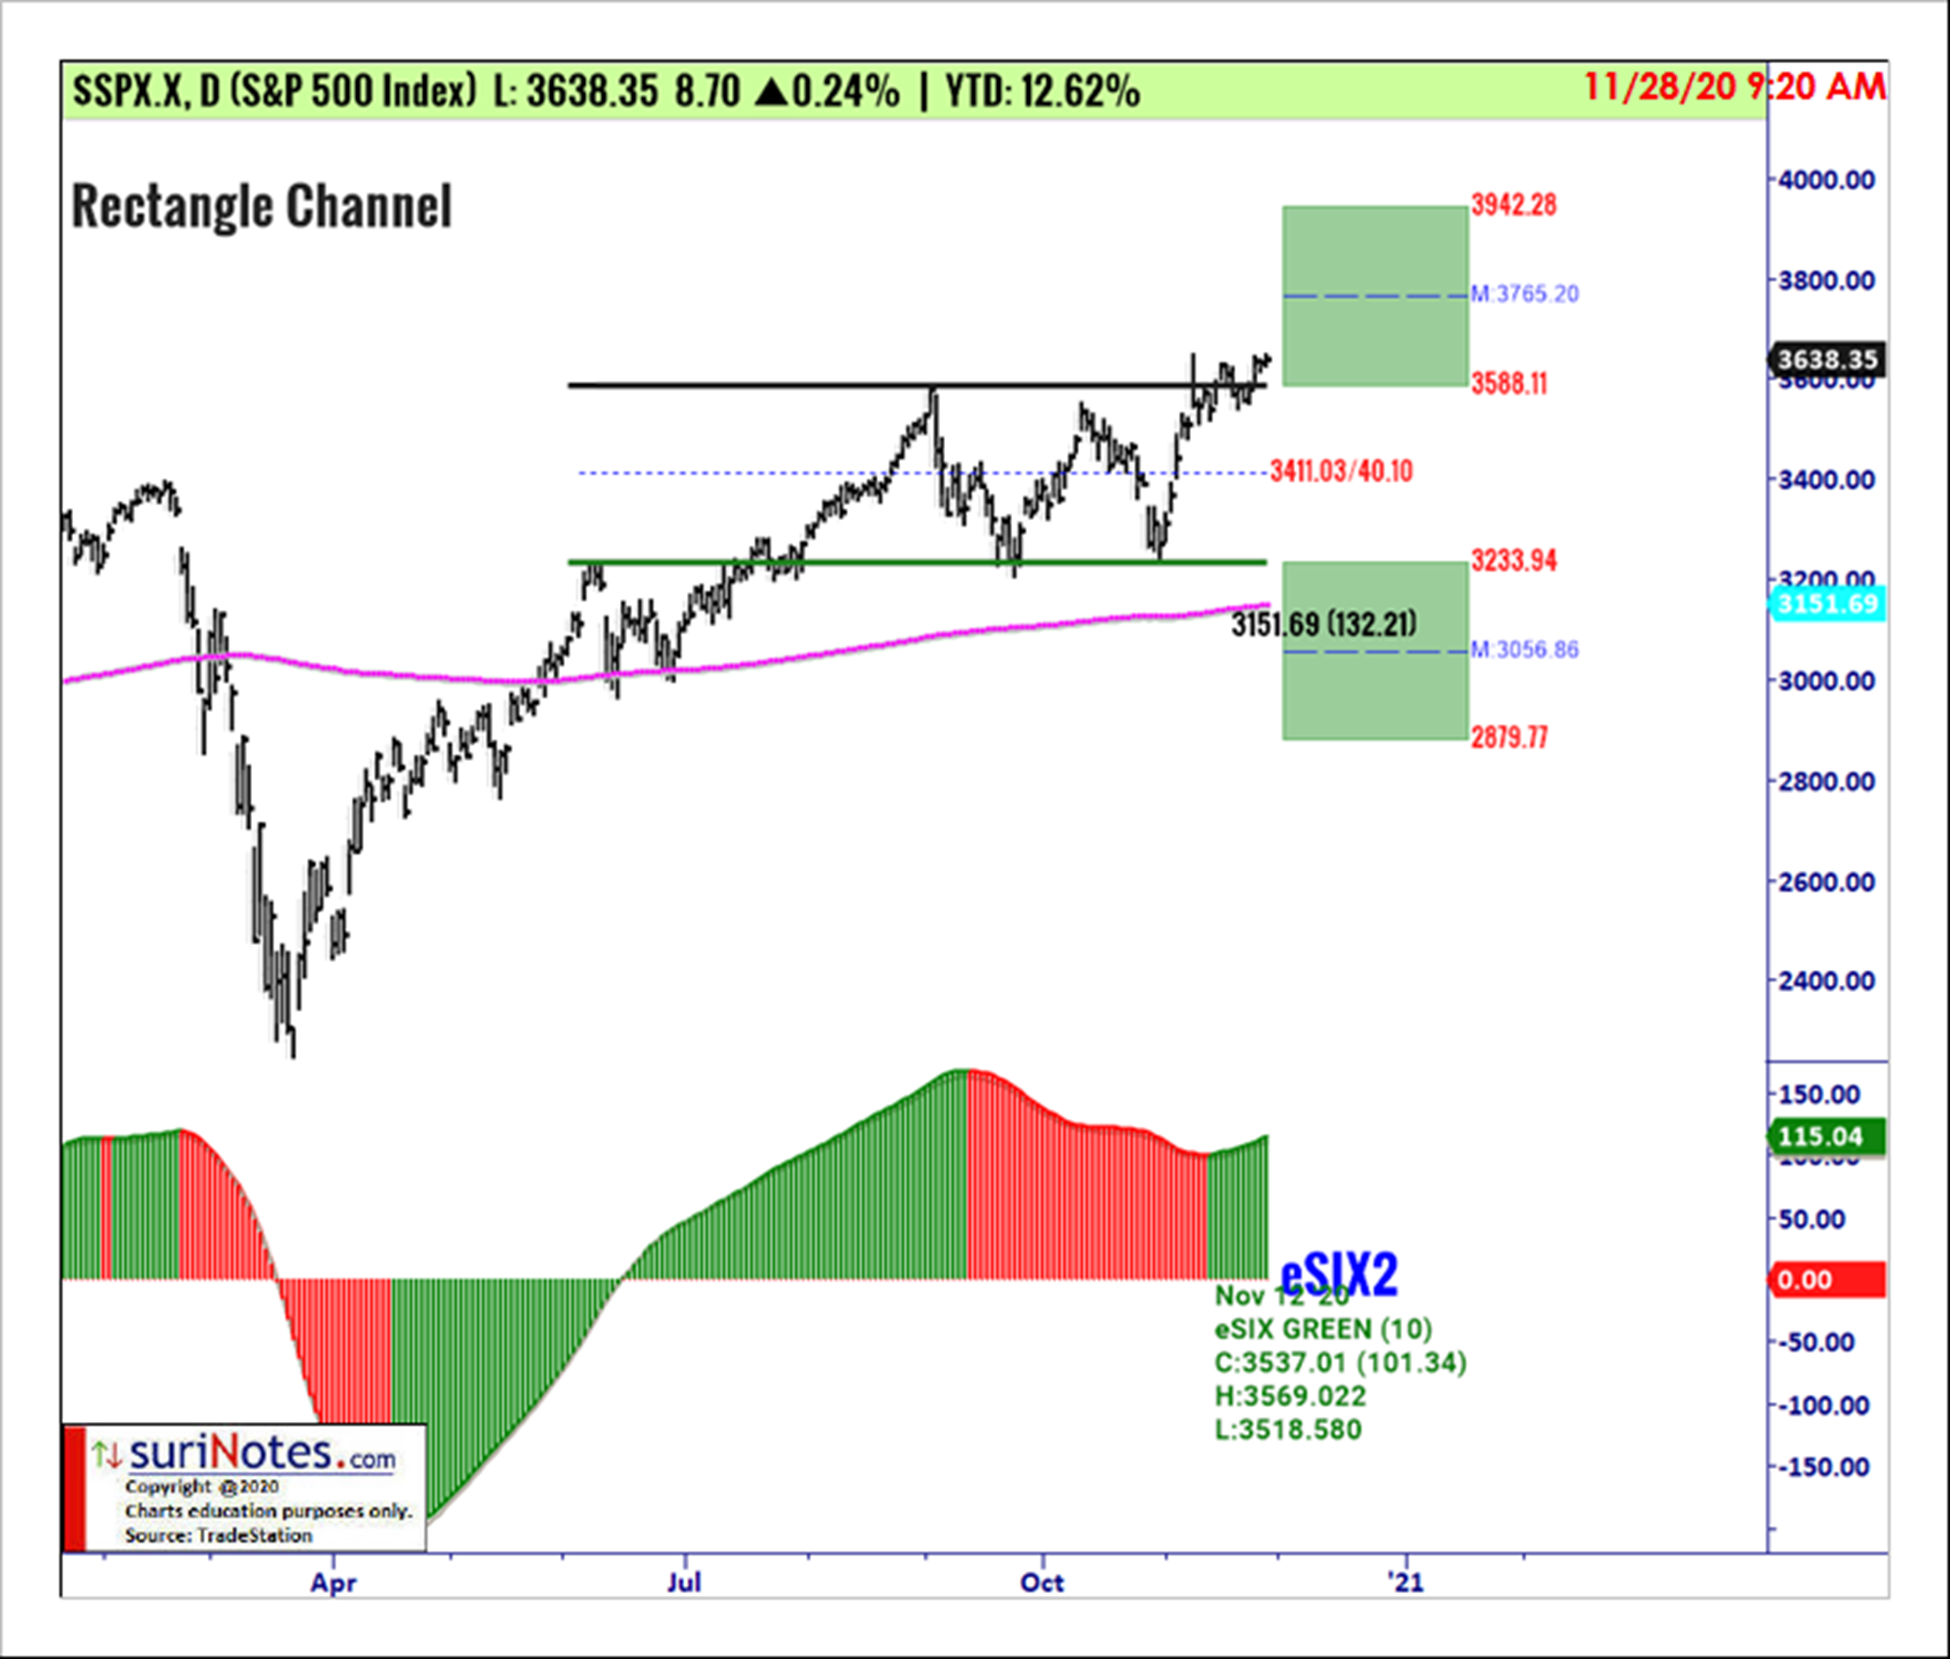
S&P 500 Index is trading in a rectangle chart pattern on its daily chart above upper trendline 3588.11. A long trade may be entered when price breaks above the upper trendline with a stop below the mid-channel level 3411.03 and vice-versa. Breakout targets are: 3765.2 to 3942.3. Breakdown targets are: 3056.9 to 2879.8.
Dow Jones Industrial Average (^DJI) Rectangle Channel Pattern
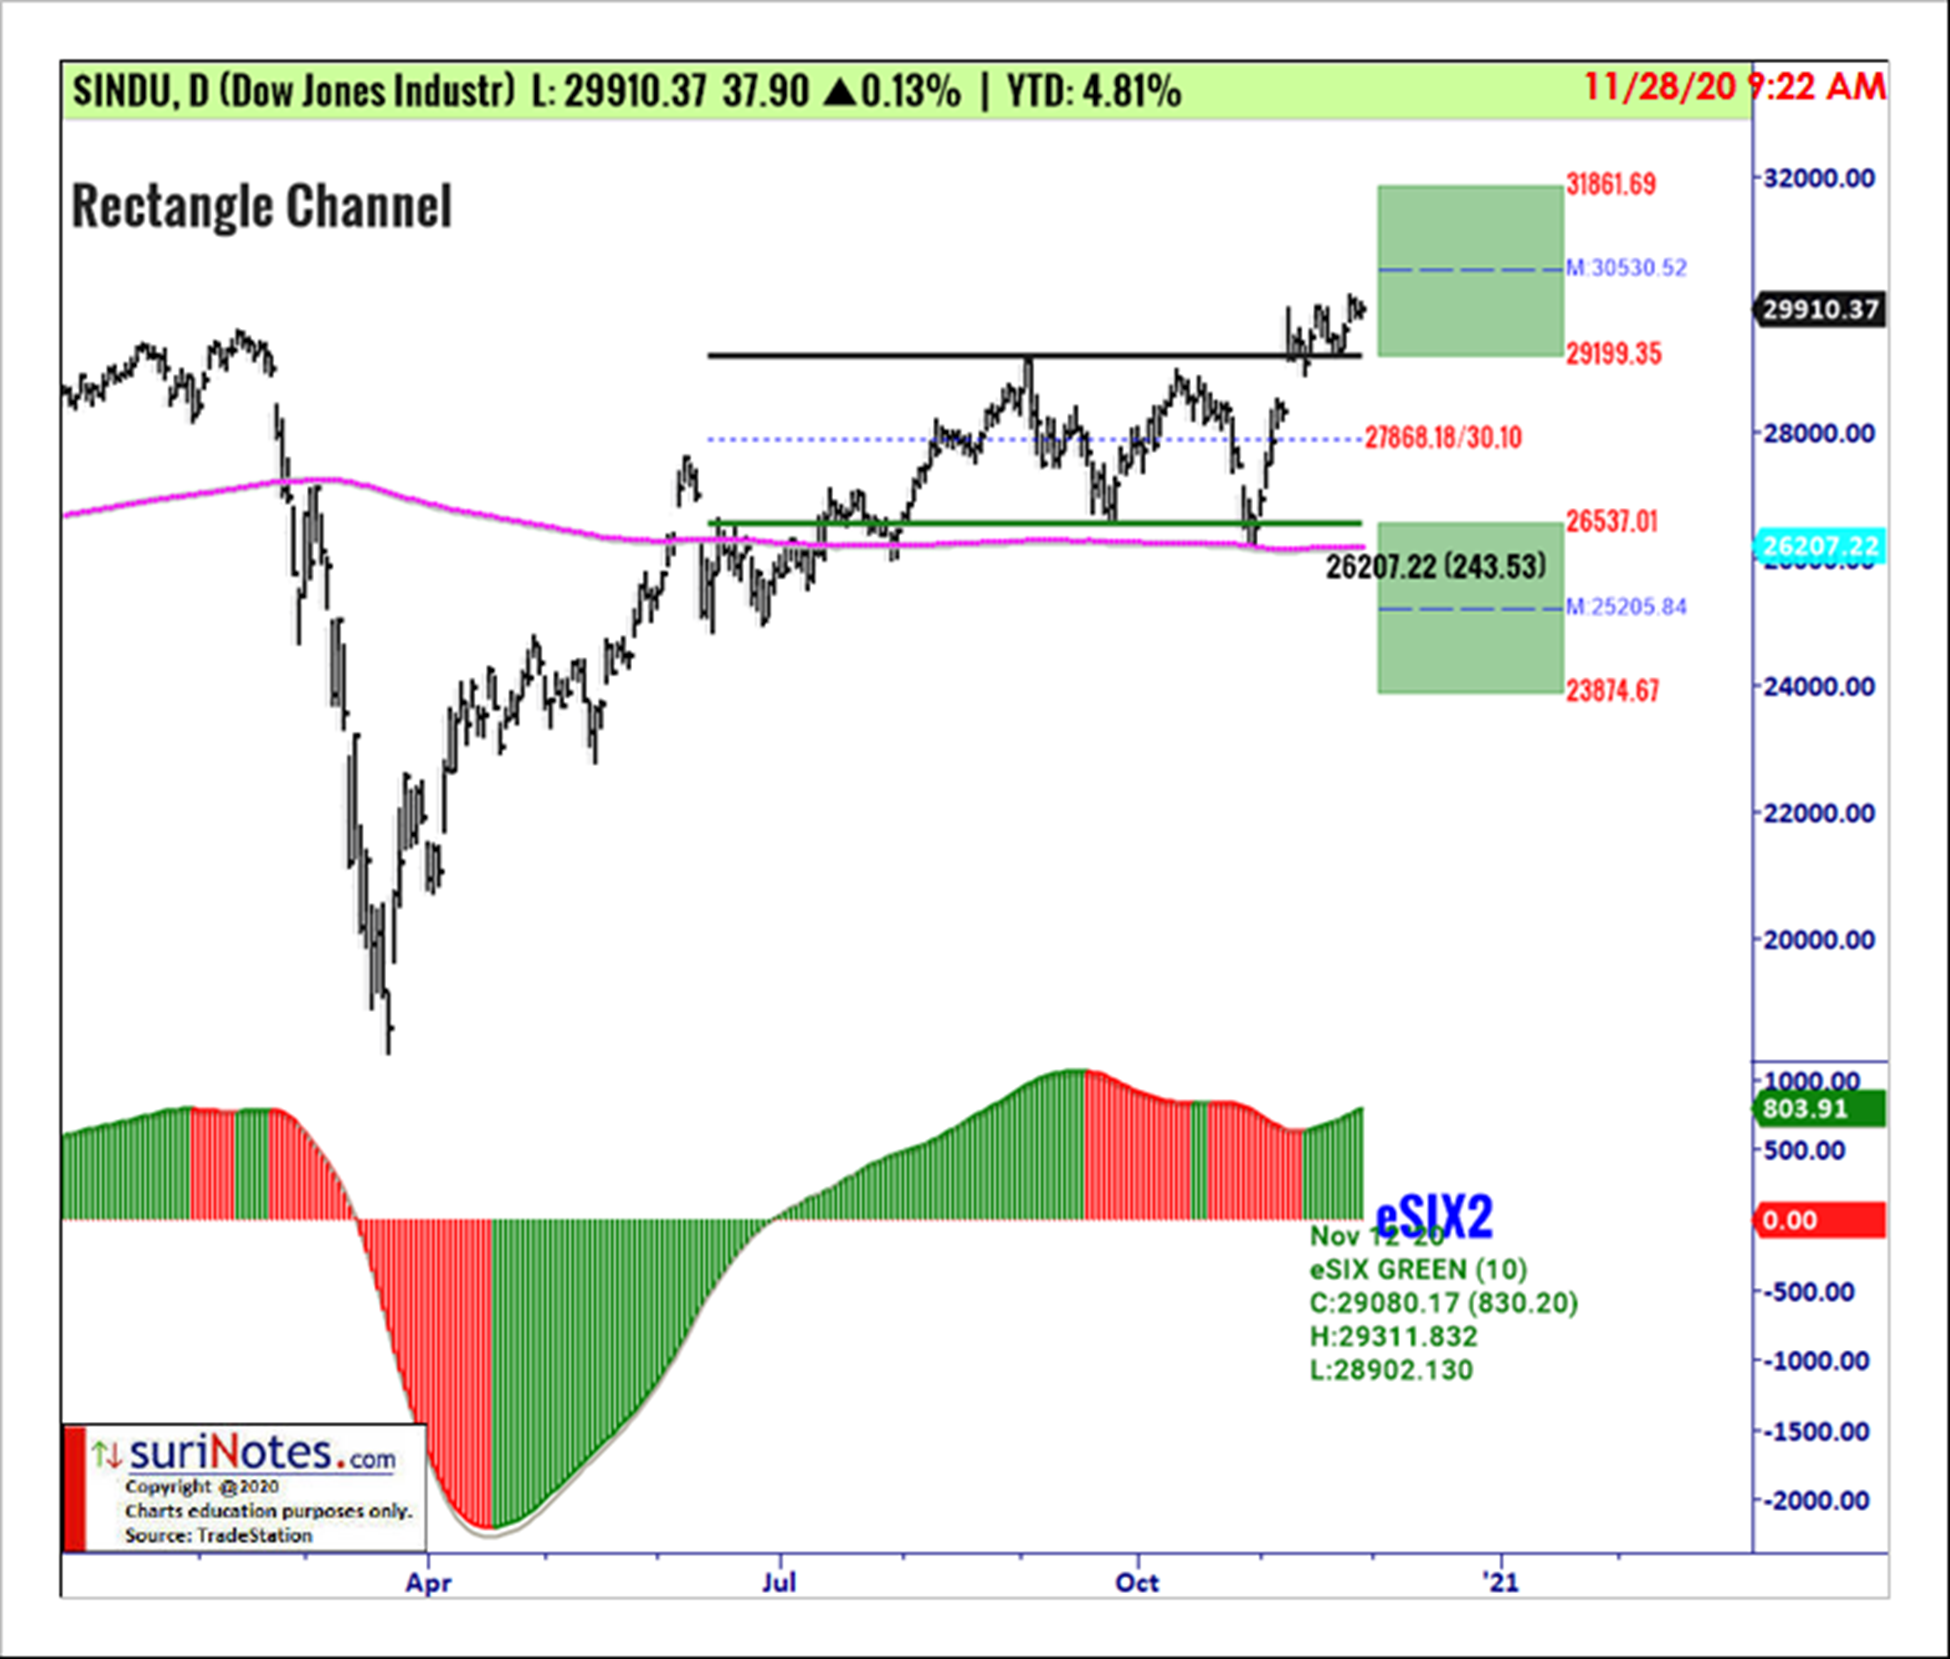
Dow Jones Industrial Average is trading in a rectangle chart pattern on its daily chart above upper trendline 29199.35. A long trade may be entered when price breaks above the upper trendline with a stop below the mid-channel level 27868.18 and vice-versa. Breakout targets are: 30530.5 to 31861.7. Breakdown targets are: 25205.8 to 23874.7.
Nasdaq Composite Index (^COMPX) Rectangle Channel Pattern
Nasdaq Composite Index is trading in a rectangle chart pattern on its daily chart above upper trendline 12108.07. A long trade may be entered when price breaks above the upper trendline with a stop below the mid-channel level 11465.32 and vice-versa. Breakout targets are: 12750.8 to 13393.6. Breakdown targets are: 10179.8 to 9537.1.
To learn more about Suri Duddella, please visit SuriNotes.com.


