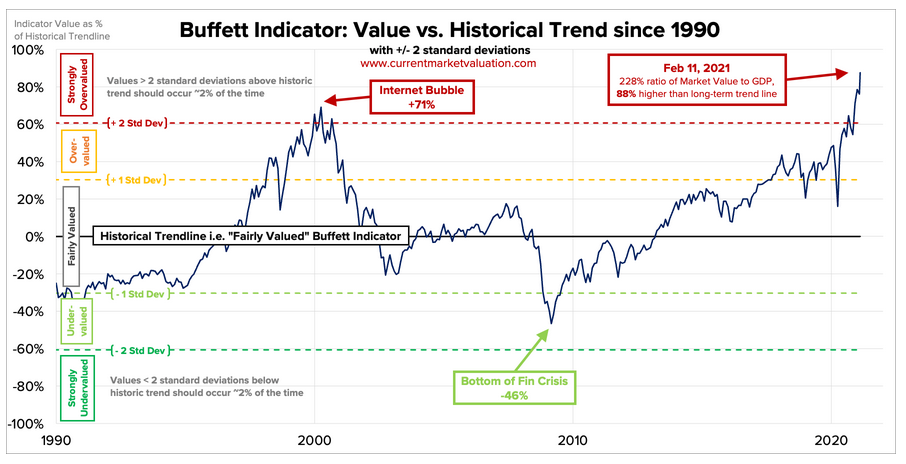
Sponsored Content - At February 11, 2021, the “Buffet Indicator”, created by legendary investor Warren Buffet, indicated that the US stock market was “Strongly Overvalued”. The indicator corroborates Michael Markowski’s recent stock market at “Perilous Peak” research finding. The Buffet Indicator’s 2000, reading, an all-time at the time, coincided with the prior Perilous Peak discovered by Markowski which also occurred in 2000.
The Buffet Indicator is calculated by dividing the total market cap of the Wilshire 5000 by US GDP. The reading depicted in the chart below of 228% at February 11, 2021, is the highest for the 1950 to 2021 period that Mr. Buffet covers. It compares to a reading of 171% in 2000. The lowest reading for Mr. Buffet’s indicator coincided with the stock market’s 2009 Great Recession bottom.

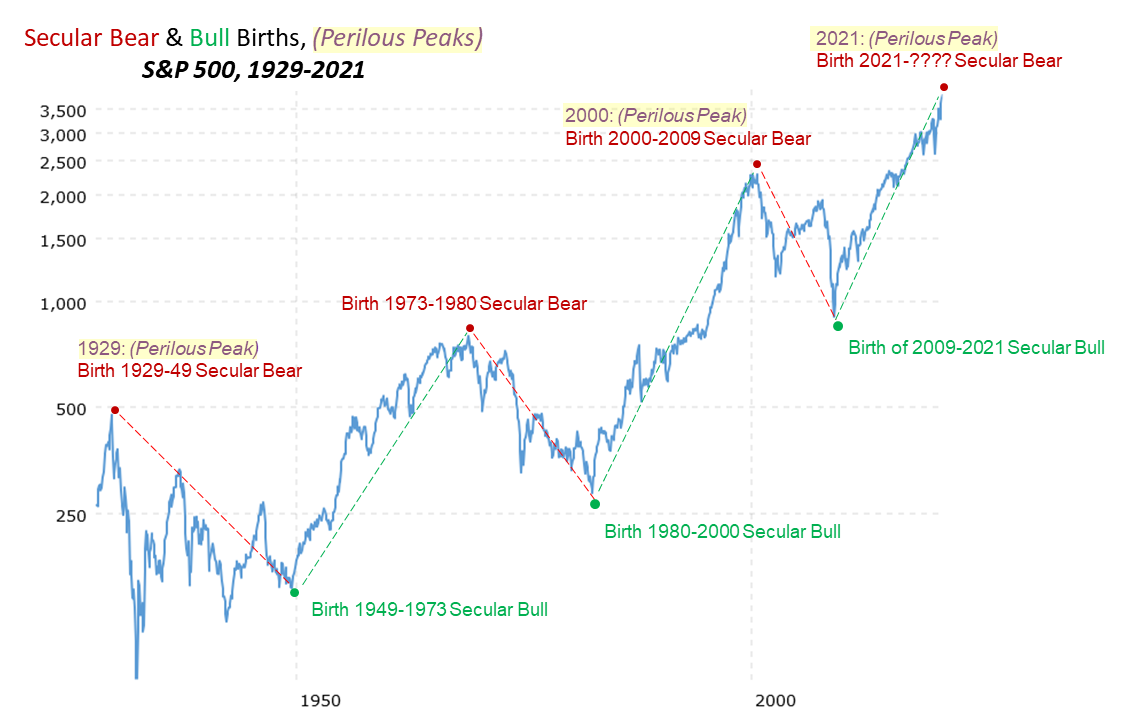
For a record high to be a “Perilous Peak” requires that the qualifying high have the DNA of a Perilous Peak, which was also discovered by Mr. Markowski, who is an experienced developer of various index and stock indicator algorithms. Mr. Markowski utilized his EPS Syndrome Cash Flow analysis indicator to predict the collapses for the US’s five largest brokers including Lehman, Bear Stearns, and Merrill Lynch in a September 2007 Equities Magazine article. The chart below depicts the S&P 500’s Perilous Peaks from 1929-2021.

Two of the Perilous Peaks in the above chart coincided with birth dates of three of the S&P 500’s Secular Bear Markets from 1929 to 2000. “Prepare for the Bear” by Michael Markowski is a great read. Michael Markowski, a 43-year market veteran informed investors what to invest in during the 1973 to 1980 and 2000 to 2009 secular bear markets.
Click here for more information about the Buffet Indicator and here for more about the DNA of a Perilous Peak.


