It seems like everyone's playing a bit of a waiting game in anticipation of this week's FOMC meeting, including MoneyShow's Tom Aspray, who offers some plays to make, since there will be an almost guaranteed new amount of market volatility after Wednesday's announcement.
Stocks put in a fine performance last week ahead of the much anticipated FOMC meeting this week. Basically, stocks only corrected a month from the August highs before, again, turning higher. Though quite a few stocks did undergo double-digit declines from their recent highs, the major averages did not.
The cooling of the situation in Syria has taken some of the pressure off the global markets, even though it may be transitory. Investors seem to be more comfortable now with the range of potential outcomes.
The majority of technical concerns about the stock market were resolved last week, but still, the market action needs to be watched closely over the next few weeks. It will be important to see technical precursors of upward acceleration to confirm sharply higher prices.
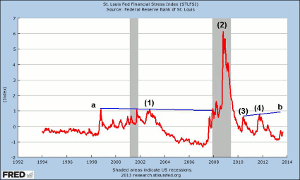
Many are still concerned about another major market decline, such as we saw in 2010 and 2011, while some even expect something worse than 2008. One measure of economic stress is the St. Louis Fed Financial Stress Index, which is "constructed from 18 weekly data series: seven interest rate series, six yield spreads, and five other indicators."
The chart shows that the Index formed a top in late 2002, (point 1), and then started a multi-year decline, finally bottoming in 2007. The Index broke through its resistance, line a, in early 2008 at the start of the recession.
The spike high reading of 6.154 came on October 17, 2008, (point 2), right in the middle of the financial panic. As stocks were bottoming in March 2009, it was down significantly at 4.14, consistent with less financial stress, even though stock prices were lower.
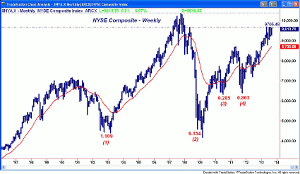
The stock market's lows in both September 2010, (point 3), and in October of 2011, (point 4), were accompanied by peaks in the Index. The chart of the NYSE Composite shows how the peaks in the Index corresponded to lows in the NYSE Composite. This includes the major low in 2009.
The Index hit a low of -0.908 in March 2013, and is in a slight uptrend now. It closed last week at -0.357. A move above the 2010 and 2011 highs, line b, would be a cause for concern. This Index and other great economic indicators can be found at the St. Louis Fed's Web site.
On the global economic front, the news continues to get better from the Eurozone, and there seems to have been a sentiment change on emerging markets as well. Just a few weeks ago, I thought there might not be a contrary opinion trade until 2014.
Some of the emerging market ETFs are already up 7%, so far, this month, as it seems like others are drawing the same conclusions. Robert Kapito, co-founder of BackRock, Inc. (BLK), which has assets of $3.9 trillion, said that "The emerging markets are going to account for about 60 to 65% of the world's growth over the next 20 years."
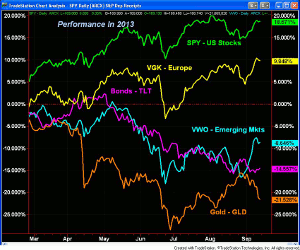
So far, in 2013, the Asset Performance chart shows that the Vanguard FTSE Emerging Markets ETF (VWO) is still down 8.4% for the year, but it was down over 19% in June. It has risen above the dismally performing bond market (TLT) and gold (GLD). This week's plunge in gold has dropped its yearly performance to -21%, but it was down over 27% in June. I reviewed both gold and the gold miners in last Friday's column.
The US stock market is still leading with the Spyder Trust (SPY) up 18.6%, while the European markets (VGK) are now up close to 10% for the year, as they have gotten a nice boost in the past three weeks.
NEXT PAGE: What to Watch
|pagebreak|There was not much in the way of economic news last week, but what we did get was not too encouraging. Retail Sales came in at just 0.2%, down from the consensus forecast of 0.5%.
The Consumer Sentiment reading from the University of Michigan was 76.8, the lowest since early in the year. It also was well below the consensus reading of 82 and last month's final reading of 80. Neither number had an immediate impact on stock prices.
This week we get the Industrial Production on Monday, along with the Empire State Manufacturing Survey. It is followed on Tuesday by the Consumer Price Index and the Housing Market Index. As I noted last month, the technical outlook for the homebuilding stocks indicated further weakness. They have now rallied from more important support and appear to be in the process of bottoming.
This week, the focus will be on the FOMC meeting, which begins on Tuesday, with an announcement on Wednesday afternoon. This is almost guaranteed to cause a pickup in volatility at the end of the week.
What to Watch
So far, September has been a pretty good month for stocks, which, as I pointed out, has been the case for the past ten years, despite the month's dismal performance over the past 50 years. The daily technical studies are positive, as the divergence resistance in the A/D lines has been overcome. The volume action has been even stronger.
I was leaning this way last week as I favored "concentrate on buying individual issues, even though the overall market may continue to be choppy." I concentrated last week on stocks in the health care, material, and energy sectors, as the latter two overcame key resistance last week.
As I noted last week, the 5-day MA of the number of S&P 500 stocks that are above their 50-day MAs dropped to levels last seen in June and had turned up. It is still rising sharply but is still below the mean at 57. These leaves quite a bit of room for improvement.
Stocks corrected slightly last Thursday, before resuming their uptrend, and the selling pressure on the first real pullback will tell us more about the health of the market.
Individual investors have been getting more and more bullish on stocks with the bullish % now up to 45.5%, as it was 28.9% at the end of August. The number of bears has declined from its high of 42.8% three weeks ago, with only 24.6% bearish last week. A recent survey of global investors indicated that global investors were not worried about the FOMC decision.
The financial newsletter writers were unchanged last week at 37.1% bullish, down from 52.1% on July 17. The number of bears dropped a bit more to 22.7%.
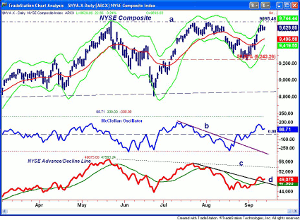
NEXT PAGE: Stocks |pagebreak|The NYSE Composite reached its daily starc+ band last week and held in a tight range for the rest of the week. As I have noted in the past, often when a starc band is reached, prices will just move sideways before resuming their former trend.
There is still key resistance from May at 9695.43, line a, with the starc+ band now at 9744. The weekly starc+ is at 9933, with the all-time high from 2007, at 10,387.
The McClellan oscillator has been above the zero line since September 4. On a 1-2 day correction, it could drop back to the -50 to -100 level. This was not a classic bottom formation, as the downtrend in the oscillator, line b, was broken a few days before the lows.
The NYSE Advance/Decline line overcame its bearish divergence resistance at line c last month and it's holding above its WMA, which is now rising. There is more important resistance for the A/D line at the downtrend, line c. A strong move above this level would be quite bullish for the stock market.
There is minor support now in the 9500 area and the rising 20-day EMA. The monthly pivot is at 9401 with the S1 support at 9329. The key support is clearly at 9246 which was the August 30 low.
S&P 500
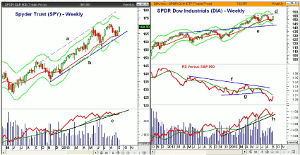
The Spyder Trust (SPY) closed the week with nice gains as the weekly candle chart indicates. The 20-week EMA provided good support for SPY over the past few weeks. There is next resistance in the $170 area with the daily starc+ band at $171.34.
The weekly starc+ band is at $174.23, with the upper boundary of the trading channel, line a, in the $178-$180 area.
The weekly on-balance volume (OBV) tested its 21-week WMA three weeks ago before turning higher. It has moved back above its uptrend, line c, which was slightly broken on the correction.
The daily S&P 500 A/D line (not shown) moved through its downtrend on September 4, and the daily OBV has slightly surpassed the August high.
There is daily support now at $167.50 with the monthly pivot at $165.89. The weekly uptrend and the 20-week EMA are now in the $163.60-$164 area.
Dow Industrials
The SPDR Dow Industrials (DIA) has traded in a tight range for the past two weeks but the ranges expanded last week as it closed with nice gains. It was up slightly more than the SPY.
The close was above the monthly pivot at $150.59 for the first time in the past three weeks. The monthly projected resistance at $163.67 has been reached with major resistance (line d) and the starc+ band at $157.30.
The relative performance has turned up, but is still negative after breaking support, line g, earlier in the summer. It is still not a market leading sector. The weekly OBV closed the week back above its rising WMA and held support at line h. The most oversold Dow stocks have rallied nicely so far this month.
Nasdaq-100
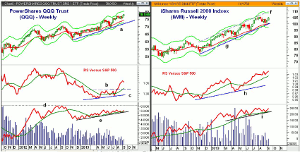
The PowerShares QQQ Trust (QQQ) closed above the highs of the prior six weeks, though was held back by the decline in Apple Inc. (AAPL) shares. The weekly stac + band is now at $80.27, which is the next major upside target.
Now that the major 50% retracement resistance from the March 2000 Nasdaq 100 high at $120.50 has been over come the 61.8% resistance stands at $86.97.
There is initial support now in the $76.60-$77.20 area and the 20-day EMA. The monthly pivot is at $75.90 with the projected monthly pivot support at $74.53.
The weekly relative performance has completed its bottom formation, line c, with the move above the resistance at line b. The RS line is well above its rising WMA.
The weekly OBV does not look as impressive, though it is holding support, line e, and is above its WMA. The daily OBV ( not shown) is much stronger and has rallied well above the prior highs. Therefore the OBV multiple time frame analysis is pointing higher.
The daily Nasdaq-100 A/D line (not shown) has overcome its bearish divergence resistance and its WMA has turned higher.
Russell 2000
The iShares Russell 2000 Index (IWM) closed above the previous three week highs. The weekly starc+ band and upper trend line is now in the $108.50 area, line f.
The relative performance made further new highs this week, and is well above its WMA, which it overcame last May. There is more important support for the RS line at line h.
The weekly OBV is very close to making new highs after testing its rising WMA and the support at line i.
The Russell 2000 A/D line (not shown) did form a bearish divergence in early August, but this downtrend has now been overcome with the A/D line above its rising WMA.
There is first support now at $103.80 with the monthly pivot now at $102.08 and major support in the $100 area.
NEXT PAGE: Sector Focus, Commodities, and Tom's Outlook
|pagebreak|Sector Focus
The iShares Dow Jones Transportation (IYT) continued to rise sharply, closing up over 2.5% for the week. I took a look at some of the railroad stocks, as several are now reaching long-term support.
The next resistance is at $119.85 and the August high with the weekly starc+ band at $122.84. The weekly studies are all positive, with the weekly OBV closing at new all time highs.
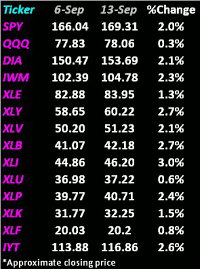
All of the 14 ETFs in my weekly performance table are in positive territory with the leaders being the Sector Select Industrials (XLI), the Sector Select Health Care (XLV) and the Sector Select Materials (XLB).
I will be looking closely at the Sector Select Industrials (XLI) next week, as it has closed the week well above the early August highs. The breakout has been confirmed by the weekly and daily OBV.
The Sector Select Financials (XLF) and the Select Sector SPDR Utilities (XLU) were the sector ETFs to close up less than 1%.
Interest Rates: The yields on both the 10-Year T-Note and the 30-Year T-Bonds closed the week lower. Another lower weekly close and a drop below the August low is needed to take the pressure off bond holders, this would postpone the pain I discussed last week.
Crude Oil
Crude oil gave up most of the prior week's gains last week. The monthly pivot support at $106.41 has been holding with further support now in the $103-$104 area.
There is resistance for the November contract now at $109.42, which was last week's high and then at $111.34. The weekly studies like the OBV are positive.
Precious Metals
The Spyder Gold Trust (GLD) dropped further on Friday and was down 5.4% for the week, confirming the bearish technical outlook discussed in Has Gold's Rally Lost Its Luster?.
On Friday, I updated my outlook and noted the better technical outlook for the gold miners, as the buy levels in the Market Vectors Gold Miners (GDX) were hit. The miners bucked the trend as GDX closed Friday up over 1%.
The Week Ahead
There was bullish action in the major averages, but some of the individual stocks look even better, as they turned higher on good volume after testing longer-term support. The ability of the market to move higher after Thursday's slight pullback suggests that we may test higher levels before we get a setback.
The improvement in the Advance/Decline lines last week had me recommending several stocks, as well as a few ETFs. This coming week, I will be looking at the industrial sector, which includes the homebuilders that are now looking more positive.
Over the past six weeks, I have recommended a dollar cost averaging strategy for both the US and emerging markets. It can be found at It's Never Too Late to Build a Portfolio. The daily technical studies on the Vanguard FTSE Emerging Markets ETF (VWO) are now positive, but the weekly studies are not.
I will be reviewing the Charts in Play portfolio next week as my recommended stops held up well during the recent correction.
Remember it is still very important to be patient and pick your spots to buy. As I mentioned at the start of the year, you need to focus on the risk of every investment or trade. If the risk is too high, the market is telling you to wait. Be sure to have a well constructed plan developed in advance.
Don't forget to read Tom's latest Trading Lesson, Power Your Portfolio with the Mass Index.

