In the last installment of a three-part series, professional trader, Ken Calhoun of TradeMastery.com and DaytradingUniversity.com, shows how to find strong trading entries.
In the first two articles of this series, we looked at price action patterns using daily trading ranges in part 1 and volatility signals in part 2. This time, we’ll be taking a closer look at breakout trading with price action patterns, and adding to winning breakouts by scaling in to wide range successful setups.
Looking for “outlier” or “special case” price action breakouts primarily involves looking for exceptionally strong trading entries as they are occurring. A common error is for traders to underestimate just how far a price-action breakout will move, and therefore miss out on continuation trade entries. By combining specific price action entry signals with scaling in to winning trades, new opportunities are available for traders to add to price-action trading positions as breakouts continue.
Price Action Pattern #1: Adding to Winning Trades With Price Action Scaled-In Entries
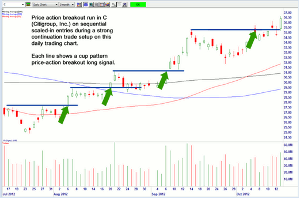
On daily candlestick charts, one strong price action pattern to follow is a breakout above cup pattern highs, as seen in Figure 1 [Citigroup, Inc. (C)]. Each sequential cup pattern provides a new price-action entry signal, as shown by the green arrows. Whenever a trade continues in-trend, the initial position is added to, with an equal number of shares.
For example, the first trade signal was generated on August 6, at just over 27.5; the second trade signal generated August 20 at just over 30.0, and so on. Adding to price-action cup breakout continuations can be an effective trade management strategy, because it allows the astute active trader an opportunity to scale into winning positions.
For swing trades, an average stop of 1.5 points is a good trailing stop value to use, which is then trailed starting with the second scaled-in trade in the series. Starting off small (no more than 100 shares), then building a trade over time, with price-action continuation entries, can help potentially minimize costs of initial stops, while optimizing the profits on successful trade sequences.
NEXT PAGE: Two More Price Action Patterns
|pagebreak|
Price Action Pattern #2: Price Action “Embedded Cup” Breakout Continuations
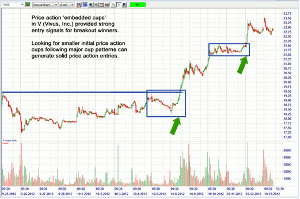
Another favorite price action pattern comes from looking for “embedded cups”. These are cup patterns, which occur at the far right side of an earlier cup, as shown in Figure 2 [Vivus, Inc. (VVUS)]. Note the major cup, which looks like the letter “U”, extending from September 25 through October 4, 2012. At the far right side of this major cup, an “embedded” smaller cup occurs, similar to a “handle” pattern, from October 5 through October 6. Following this cup, the entry signal is generated as price action broke resistance on October 8, over the 19.5 resistance area.
A secondary cup continuation pattern is also marked out, which occurred October 10 and 11, finally breaking to new highs on October 12, above the 22.25 price-action long trigger. These embedded cup patterns reflect indecisiveness of the traders right before a continuation price action breakout, and are a particularly useful pattern to recognize in charts, since they often occur right ahead of large price action breakouts, as shown in Figure 2.
Scaling into, or adding to a winning trade, can often be facilitated by spotting these embedded cups, and adding above new cup high breakouts once in an initial winning position. Once the initial trade is entered, a hard stop is set 1.5 points below the entry. Once a second trade is entered, to add to the initial winning trade, the hard stop is set to breakeven. And once it continues moving up, for those that do generate additional price action winning setups, a trailing stop of from .75 to 1.5 points is used, based on the relative strength of the chart pattern (for swing trading stocks and ETFs).
Price Action Pattern #3: Price Action “Scalping Cup” Entries
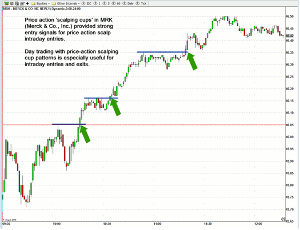
Using one-minute candlestick “scalping cups”, as shown in Figure 3 [Merck & Co., Inc. (MRK)] is especially useful for fast intraday trades of from 5 to 40 minute round trips. These setups occur once price action has pierced new highs in the one-minute cups, and shows just how strong these patterns can be, once they’re correctly identified.
Entries can be scaled into by adding to winning trades over each new “scalping cup” breakout signal, using price action to help navigate entries and exits during the breakout run. The best of these patterns occurs as the whole real body of the one-minute candle is piercing the horizontal resistance line, to indicate strongest price-action volatility during the day trading breakout entry.
In our next article we’ll look at developing a trading plan based on price action entry signals.
Ken Calhoun is a trading professional who has traded millions of dollars of equities since the 1990s, and is the producer of multiple award-winning trading courses and video-based training systems for active traders. He is a UCLA alumnus and is the founder of TradeMastery.com andDaytradingUniversity.com, popular online educational sites for active traders.


