After last week's FOMC decision not to taper, there were sharp declines and a lot of debate surrounding the stock market's new direction, but for MoneyShow’s Tom Aspray, the market's action this week is even more important.
The very weak close last Friday has stimulated quite a bit of debate about the stock market’s direction. Many of the major averages broke through weekly resistance last week, suggesting that the major uptrends had resumed.
On the other hand, Friday’s sharp drop caused the formation of what appears to be daily top formations. For example, the PowerShares QQQ Trust (QQQ) formed a doji last Thursday, and the weak close on Friday triggered a LCD sell signal. The relative performance analysis of the QQQ indicates it is a market leading sector. It has next good support at $77.60-$78.20.
As I reviewed in depth on Friday, the volume analysis has confirmed the market’s action, while many of the A/D lines, though positive, have made new highs. This makes the action early this week important. In early trading, the apparent election victory by Germany’s Angela Merkel gives the market one less thing to worry about, but the futures are a bit lower in early trading.
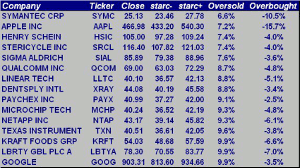
The weekly starc band scan of the Nasdaq 100 revealed those stocks that were closest to their lower or starc- bands. Apple Inc. (AAPL) is leading the financial headlines, but with last Friday’s close is the second most oversold stock on the list. It closed at $466.98, which is just 7.2% above the weekly starc- band at $433.20. It is 15.7% below the starc+ band at $540.30.
These scans I use to focus on segments of stocks that are then examined in more detail looking at the volume and relative performance over multiple time frames. Three of these stocks look attractive at levels not far below last Friday’s close.
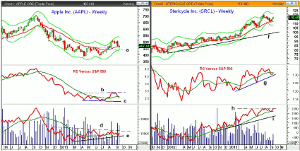
Chart Analysis: The weekly chart of Apple Inc. (AAPL) shows that it pulled back to its breakout level, line a, last week.
- The 50% Fibonacci retracement support of the rally from the June lows to the August highs is at $451.48 and was broken last week.
- The 61.8% support is at $436.77, with the quarterly pivot at $420.02.
- The weekly relative performance is trying to bottom, line c, as it has dropped back to its WMA.
- The RS line needs to move above the resistance, at line b, to signal it is now a market leading sector.
- The OBV has formed higher lows, line e, and closed just barely above it WMA.
- The OBV needs to move above the resistance, at line d, to complete a major bottom.
- There is weekly resistance now in the $483-$493 area.
Stericyle Inc. (SRCL) is a $10 billion waste management company that broke out through major resistance in March and hit a high of $119.49.
- On September 3, it hit a low of $111.21, which was a drop of 7%.
- Last week’s high was $117.58, so it has now retraced more than 61.8% of the decline.
- The weekly relative performance shows a strong uptrend, line g.
- The RS line has turned up, but is still below its flat WMA.
- The on-balance volume (OBV) is acting stronger, as it has turned up from its WMA.
- It is very close to breaking out above the several month resistance, at line h.
- There is minor support now at $115, with stronger at $113.95, which is the monthly pivot.
NEXT PAGE: Two More Stocks to Watch
|pagebreak|Dentsply International Inc. (XRAY) is a $6.27 billion medical instrument and supply company that focuses on dental products.
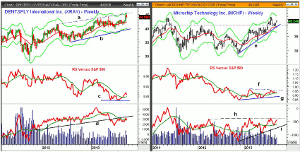
- The chart shows that just two weeks ago, it tested the weekly trend line resistance, line a, that goes back to the 2012 high.
- It also came very close to the weekly starc+ band.
- The relative performance is trying to form a short term bottom, line c, and has moved above its WMA.
- It is not clear yet that the RS line has formed a new uptrend.
- The OBV was weak on the rally, as it just retested formed support, now resistance at line d.
- The daily OBV (not shown) has turned lower, but is still above its WMA.
- There is initial support at $42.80-$43, with the rising 20-WK EMA at 442.36.
Microchip Technology Inc. (MCHP) is a $7.94 billion specialized semiconductor stock that also yields 3.50%.
- MCHP broke through major resistance at $39 and reached a high of $41.78, which was slightly above the 2011 high.
- In early July, MCHP retested the breakout level in late August with a low of $38.44.
- The relative performance closed just above its slightly rising WMA, but is still locked in its trading range, lines f and g.
- The weekly OBV has turned up sharply from its flat WMA with key resistance at line h.
- The OBV has good long-term support at the uptrend, line i.
- There is initial support at $39.68 and then further at $38.50-$38.25.
What it Means: The major averages and the S&P futures could drop back to their rising 20-day EMA, which is at 1679 for the futures. The next two to three days will be an important test for the market.
The technical action after last week’s close indicated that Apple Inc. (AAPL), Stericyle Inc. (SRCL), and Microchip Technology Inc. (MCHP) should be a bought on a pullback. However, Apple Inc. (AAPL) is up sharply in pre-opening trading, on the back of very strong phone sales, so a good risk reward entry looks unlikely right now.
The technical outlook for Dentsply International Inc. (XRAY) is more consistent with a false breakout.
How to Profit: For Stericyle Inc. (SRCL), go 50% long at $115.28 and 50% long at $113.62, with a stop at $109.77 (risk of 4%).
For Microchip Technology Inc. (MCHP), go 50% long at $39.75 and 50% long at $39.14, with a stop at $37.64 (risk of 4.5%).


