After today's meeting, we will finally know whether the Fed is going to begin the tapering process or not, a question that has plagued the markets all summer, however, the important thing for MoneyShow’s Tom Aspray, is the technical outlook for the stock market.
By this time tomorrow, the markets will have the answer to the question they have been wondering about since earlier in the summer. A recent Bloomberg survey of investors revealed that 57% do not expect much of a reaction by the markets if the Fed reduces their bond buying by $10-15 billion.
Of the economists, the Wall Street Journal says that 66% do expect the Fed to start the tapering process today as they see enough improvement in the economic data to justify this action. Therefore, if the Fed does not begin the tapering process, some will conclude that the economy is actually weaker than most think.
For me, what really matters is the technical outlook for the stock market, which has improved further with this week’s action. The A/D lines have broken resistance and started new uptrends, while the OBV has confirmed new market highs for both the Spyder Trust (SPY) as well as the S&P futures.
In Europe, stocks are trading higher, with the German Dax breaking out to new highs. In this environment, there are quite a few opinions about which sectors will do best. In yesterday’s column, I examined three stocks in the top sectors.
The financial ETFs have had a good year with the Select Sector SPDR Financial (XLF) up 26.1% YTD, and the iShares US Financial Services ETF (IYG) gaining 26.9%. The PowerShares KBW Bank (KBWB) focuses on the big banks and has gained 27.5%. Is this the ETF for your portfolio or should you instead just buy one of the big banks?
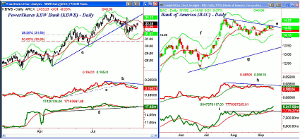
Chart Analysis: The PowerShares KBW Bank (KBWB) has assets of $131 million and trades 178K per day. It just has 25 holdings, with over 30% in Citigroup Inc. (C), Bank of America (BAC), JP Morgan Chase (JPM) and Wells Fargo & Co. (WFC).
- KBWB peaked at $34.48 in early August and by the end of the month had reached a low of $31.73.
- This was a correction of 8% and the rally from the lows, see circle, has not yet been impressive.
- The 61.8% Fibonacci retracement resistance at $33.43 has not been overcome with further resistance at $34.10 and the former uptrend, line a.
- The relative performance did form a negative divergence at the highs, line b, that was confirmed by the break of the uptrend, line c.
- The OBV has been in a tight range, which is consistent with a lower volume ETF.
- The monthly pivot is at $32.74 with further support at $32.42.
- The 38.2% retracement support from the late April lows is at $31.59.
Bank of America (BAC) has been bumping into its downtrend, line e, over the past six days. The high for the month has been $14.68.
- In July-August the highs were at $15.00 and $14.97 with a low of $13.98.
- A completion of the flag, or continuation pattern, is in the $15.35 area, which also corresponds to the monthly projected resistance.
- The relative performance has been below its WMA since the start of the week.
- The RS line has been in a narrow range with resistance at line h.
- The daily on-balance volume (OBV) broke through resistance early in the month as it has moved well above the resistance at line i.
- The weekly OBV (not shown) is also above its WMA.
- There is minor support now at $14.20-35.
NEXT PAGE: Two More Banks to Watch
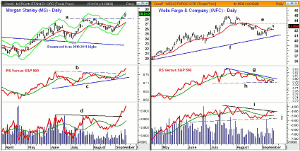
|pagebreak|Morgan Stanley (MS) closed above the August high at $28.02, line a, on September 10. It has been strong this week as the monthly projected resistance at $29.01 has been hit.
- The high from early 2011 was at $31.04 with a 2009 high at $35.78.
- The all-time high at $91.36 came in 2007 and the major 38.2% retracement resistance is at $38.69.
- The relative performance confirmed the price breakout by overcoming the resistance at line b.
- The RS line has been in a solid uptrend since the July lows, line c.
- The OBV also staged a major breakout, line d, and has accelerated to the upside.
- The weekly RS and OBV analysis (not shown) are also both positive.
- There is initial support now at $27.35-$27.80 with the monthly pivot at $26.34.
Wells Fargo & Company (WFC) last week came very close to the uptrend, line f, from the February and April lows as it dropped to $40.89.
- The rebound from the lows has stalled so far below the minor 61.8% retracement resistance at $43.31, line e.
- There is further resistance in the $44-$44.82 area, which corresponds to the recent highs.
- The relative performance is in a short-term downtrend, line g, and it is slightly below its WMA.
- The daily RS line has support at line h, and a convincing break of this level would be negative.
- The daily OBV is also in a short-term downtrend, line i, but it is still well above its flat WMA.
- There is more important OBV support now at line j.
- There is short-term support now at $42 to $42.25 and the monthly pivot.
What it Means: Of the three financial ETFs discussed earlier, the best YTD performer PowerShares KBW Bank (KBWB) looks the weakest technically. It is also the one that has the clearest concentration in the large money center banks.
Of these, Bank of America (BAC) and Morgan Stanley (MS) do look much better technically than Wells Fargo & Company (WFC). This reinforces the importance of being selective and how the better relative performance of a few stocks can be masked in an ETF.
How to Profit: For Bank of America (BAC), go 50% long at $14.36 and 50% long at $14.23, with a stop at $13.66 (risk of approx. 4.4%).
For Morgan Stanley (MS), go 50% long at $27.81 and 50% long at $27.25, with a stop at $25.93 (risk of approx. 5.8%).


