Although it has been one of the worst-performing sectors of the year, it appears to have woken up and staged a breakout, and MoneyShow’s Tom Aspray highlights three stocks that are leading the charge.
It was a great start to the market week as the market closed broadly higher with advancing stocks leading decliners by a 3.6 to 1 margin. The NYSE Advance/Decline has broken its downtrend from the July-August highs, which is a positive sign. It indicates that the worst of the selling is now likely over. But, still, investors should be prepared for some downdrafts and choppy action as the month continues.
Some of the biggest leaders were emerging markets as the ETFs tracking Indonesia, Thailand, Turkey, and India all had gains of over 5% for the day. The material stocks also did well with the Select Sector SPDR Materials (XLB) gaining 1.4%. It has broken out to the upside and three stocks in this sector are leading the S&P and show positive volume patterns.
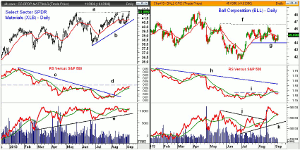
Chart Analysis: The daily chart of the Select Sector SPDR Materials (XLB) closed just above the resistance, line a, that connects the May and August highs.
- The 127.2% Fibonacci target is at $42.53 with trading range targets in the $44.50-$45 area.
- The relative performance broke its downtrend, line c, in August and has held above its rising WMA.
- The RS line has next key support at line d.
- The on-balance volume (OBV) shows an uptrend from the February lows, line e, and has moved back above its WMA.
- There is initial support now at $41.10 and at $40.76, which is the monthly pivot.
- The monthly projected support is at $39.85.
Ball Corporation (BLL) is a $6.53 billion dollar container company that closed strong after holding the support in the $43.90 area, line g.
- The next key resistance, line g, is in the $46.50-$46.60 area, line f.
- Ball Corporation (BLL) had a high in April of $48.50.
- The relative performance completed its bottom formation in August when the resistance at line i was overcome.
- A move back above its WMA will further indicate that it is a market leading sector with longer-term resistance at line h.
- The daily OBV surged in August moving well above its resistance at line j.
- Though prices were in a sideways range, the OBV was in a clear uptrend, indicating accumulation.
- There is initial support now in the $44-44.40 area with the monthly projected low at $43.43.
NEXT PAGE: 2 More Materials Stocks to Watch
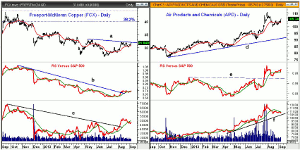
|pagebreak|Freeport McMoran Copper and Gold (FCX) is now testing its downtrend, line a, in the $32 area with the August high at $32.40.
- There is further resistance from May at $33.25 with the February highs at $36.26.
- The 38.2% Fibonacci retracement resistance from the early 2012 highs is at $40.
- The downtrend in the relative performance from the late 2012 high, line b, was broken in August.
- The RS line is holding above its rising WMA.
- The OBV also overcame its resistance, line c, in August and then broke out above the May-June highs.
- The weekly RS and OBV (not shown) are both above their WMAs.
- There is initial support at $31-$31.40 with the monthly pivot at $30.39.
Air Products and Chemicals Inc. (APD) was an earlier pick from April 10 that was stopped out at $106.70 for a 16.5% profit.
- APD hit a high in early August at $111 with a low of $99.76.
- There is near-term resistance now in the $108 area.
- The daily relative performance broke through its resistance, line e, in late July.
- The RS line is holding above its rising WMA and the weekly (not shown) is also positive.
- The daily OBV shows a strong uptrend, line f, and is now close to moving back above its WMA.
- The weekly OBV (not shown) has surged this summer and is acting much stronger than prices.
- There is minor support now in the $104-$104.40 area and then in the $101-$102 area.
What It Means: The surge in emerging markets has bullish implications for the materials sector as their weak economies have been depressing the material stocks. As I mentioned a few weeks ago, buying emerging markets looked like a contrary opinion trade for 2014, but it now looks like the turn was closer than I thought.
I would expect a pullback in emerging markets over the next few weeks and would stick with the previously recommended dollar cost averaging strategy in the Vanguard FTSE Emerging Markets ETF (VWO).
How to Profit: For Select Sector SPDR Materials (XLB), go 50% long at $41.68 and 50% long at $40.54, with a stop at $39.59 (risk of approx. 2.7%).
For Ball Corporation (BLL), go 50% long at $44.68 and 50% long at $43.54, with a stop at $42.92 (risk of approx. 2.7%).
For Freeport McMoran Copper and Gold (FCX), go 50% long at $31.54 and 50% long at $30.44, with a stop at $29.73 (risk of approx. 4.1%).
For Air Products and Chemicals Inc. (APD), go 50% long at $104.08 and 50% long at $102.44, with a stop at $97.43 (risk of approx. 5.6%).
Editor’s Note: I was sorry to learn that Joseph Granville, developer of the on-balance volume, passed away over the weekend. I had the pleasure of meeting Joe a few times and in addition to being a pioneer in technical analysis, he was a real character. Students of the market will find Bloomberg’s obituary quite interesting.


