Several department stores are set to report earnings this week as MoneyShow’s Tom Aspray turns the spotlight on retail stocks to see whether it makes sense to buy them ahead of their announcements.
The stock market started off the week with a mixed close as once again the Nasdaq did manage a positive close while the S&P 500 and Dow Industrials were a bit lower. Market internals were positive. The overnight tone in stocks is positive with Asian, European, and stock index futures all higher.
The daily technical studies are locked in tight ranges and despite some divergences there are no strong sell signals. A close in the Spyder Trust (SPY) above $170.40 should be enough to turn the focus back on the upside.
There is a full slate of economic data for the rest of the week, starting with Retail Sales out before the opening today. Estimates are for a 0.3% gain in July following a 0.4% rise in June but there is much debate on the outlook for consumer spending trends.
Last week’s mixed earnings for the retail sector has increased the focus on the three large department stores that release earnings this week. Last week, Michael Kors (KORS) reported great earnings and closed up 4.7% for the week while American Eagle Outfitters (AEO) disappointed and lost almost 16%.
The outlook for the back-to-school shopping season is generally pessimistic and earnings misses may punish Macy’s Inc. (M), Kohl’s Corp. (KSS), and Nordstrom Inc. (JWN) when they report this week. This sector typically starts a strong seasonal pattern in the fall but is it too early to buy now?
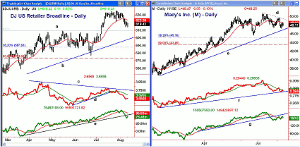
Chart Analysis: The chart of the DJ US Broadline Retailers (DJUSRB) dropped last week after reaching a high of 635 in late July.
- It is now down 2.6% from the highs with next support in the 610 area.
- The daily uptrend is now at 610 (line b) with the 38.2% Fibonacci retracement support at 587.83, which is about 5% below current levels.
- The relative performance shows a pattern of lower highs, line c, as it failed to confirm the recent highs.
- The uptrend in the RS line was broken on July 22 before the index dropped.
- The OBV has also dropped below its long-term uptrend, line e, and is now well below its declining WMA.
- There is initial resistance at 623 and the declining 20-day EMA.
Macy’s Inc. (M) topped out at $50.77 in early July and has been declining for the past five weeks.
- The uptrend from the early 2013 lows is now at $46.96 with the quarterly pivot at $46.67 and the June low at $45.72.
- The 38.2% Fibonacci retracement support from the November 2012 low is at $45.16.
- The 50% retracement support is at $43.46 and corrections often bottom between these two retracement levels.
- The relative performance dropped below its WMA on July 11 and began its downtrend.
- The RS line is now testing more important support at line f, which is likely to be broken.
- The daily OBV did confirm the July highs but has since dropped below its WMA and the uptrend, line g, which now represents resistance.
- The weekly OBV (not shown) is just slightly below its WMA.
NEXT PAGE: What It Means
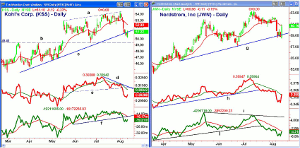
|pagebreak|Kohl’s Corp. (KSS) has been hit hard since it peaked on August 1 at $54.38 as it is already down 6.8% and has broken its uptrend, line c. This is despite its relatively attractive yield of 2.80%.
- The quarterly pivot is at $50.04 with further support at $49.40, line b. This is also the 38.2% support level.
- The daily chart shows that KSS formed higher highs, line a, while the relative performance formed lower highs, line d.
- The RS line broke support at line e last week.
- The OBV also dropped below support at line f last week and is well below its WMA.
- The weekly OBV (not shown) is still holding above its rising WMA.
- There is initial resistance now at $52.60-$53, which includes the monthly pivot level.
Nordstrom, Inc. (JWN) had an impressive 3.4% gain Monday on the highest volume since last May. It closed just barely above its WMA.
- JWN peaked July 11 at $63.34, and early Monday, tested the $58.50 level along with the uptrend, line g.
- There is further support at $57.50, which was the June low.
- The relative performance did make a new high in early July before dropping sharply.
- The break through the uptrend, line h, indicates it is lagging the S&P 500.
- The daily on-balance volume (OBV) did not confirm the recent price highs, line i.
- This negative divergence was confirmed by the break of support at line j.
- The weekly OBV (not shown) is now testing its WMA.
What it Means: The daily technical outlook for all three stocks is negative and Kohl’s Corp. (KSS) is acting the weakest.
On a longer-term basis, Macy’s Inc. (M) looks the most attractive but I would only buy on a further decline where the risk can be well controlled.
How to Profit: For Macy’s Inc. (M), go 50% long at $45.78 and 50% long at $ 44.54, with a stop at $43.29 (risk of approx. 4.1%).


