No surprises that both the ECB and BOE left interest rates and monetary policies unchanged during their meetings this week as MoneyShow’s Tom Aspray takes the pulse of some of Europe’s largest banks.
It was up, up and away for stocks Thursday, with the futures trading sharply higher overnight as the market gapped higher on the opening, squeezing the shorts. The Spyder Trust (SPY) closed Wednesday at $168.71 but opened Thursday at $169.99 giving those on the short side little opportunity to reduce their losses.
Asian stocks finished the week on a strong note with the Nikkei 225 up 3%, but European markets are up just slightly ahead of the monthly job reports. It was quiet in the stock index futures in early trading, and the bond market is being watched very closely. The yield of the 10-year T-note closed Wednesday above 2.634%, which I noted Monday would be a sign that the uptrend in yields had resumed.
The outlook for Europe has improved over the past month or so as consumer confidence has risen and some unemployment rates have actually dropped. But despite this there are still some problems in the Eurozone as Barclays, PLC (BCS) posted a net loss on Tuesday and the stock dropped over 7%.
The index that tracks 30 of the major global banking stocks still looks positive but two other large Euro banks have vulnerable charts suggesting that they may face more trouble in the weeks ahead.
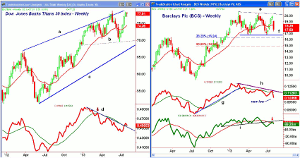
Chart Analysis: The Dow Jones Banks Titans 30 Index (DJTBAK) is composed of the largest global banks with 33% of the stocks in the US. Approximately 27% of the index’s holdings are based on UK and European banks.
- The weekly resistance, line a, was surpassed in May as the index hit a high of 78.88.
- The recent rally has taken DJTBAK back to the May highs but they have not yet been surpassed.
- The relative performance completed its bottom formation in August 2012, which led to a 29% rally until it topped out at the start of March.
- The top was indicated by the divergence in the RS line as it then rallied back to its declining WMA (see arrow).
- The downtrend in the RS line has just been broken but it needs to move above the recent high to start a new uptrend.
- The correction from the May highs violated the March lows and created an important level of support in the 69-70 area.
- A break of this level will signal a decline to the uptrend, line c, in the 67 area.
Barclays PLC (BCS) is a $54.1 billion money center bank that currently yields 1.30%. The stock traded as high as $19.98 in July but hit a low on the last day of July at $17.39.
- This was a decline of 13% and the weekly chart now shows important support, line f, at $16.77.
- Once below this level, the 38.2% Fibonacci retracement support is at $16.24 with the 50% support at $14.90.
- The measured target from the top formation, line a and b, is in the $13 area.
- The relative performance has already dropped to new correction lows suggesting prices are likely to follow.
- The weekly OBV violated support on June 7 and has just rebounded back to its WMA.
- As I noted in an article on OBV analysis, this is a quite-reliable negative formation.
- There is initial resistance now at $18.17, which is the quarterly pivot level with the 20-week EMA at $18.39.
NEXT PAGE: 2 More Vulnerable Euro Banks
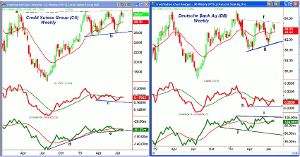
|pagebreak|Credit Suisse Group (CS) is a $40.2 billion Swiss-based foreign money center bank that has a current yield 0.40%.
- The weekly chart shows that the long-term resistance at line a, in the $30.40-$30.60 area, was tested last week.
- There is further resistance from late 2011 at $32.41 with the 2011 high at $47.63.
- A convincing upside breakout would project a move to the $35-$36 area.
- The relative performance, unlike prices, has formed lower lows, line c.
- The RS line is just barely above its flat WMA so the action over the next few weeks will be important.
- The on-balance volume (OBV) broke its uptrend, line d, at the end of March.
- The OBV is just below its WMA and a break of support at line e would be negative.
- There is first support in the $28.60 area with the quarterly pivot now at $27.75.
- Major support is in the $25.40-$26 area, line b.
Deutsche Bank AG (DB) is a $42.8 billion German money center bank that has traded between $53.12 and $38.18 in 2013.
- The weekly chart shows a narrowing trading range, lines f and g.
- The next resistance is at $48.21-$49.14 (line f), which if overcome, should signal a test of the year’s highs.
- The weekly studies need a strong rally to reverse their deterioration.
- The relative performance shows a potential bottom formation but looks ready to close the week below its WMA.
- The RS line needs to move above the April highs to complete a bottom formation.
- The OBV is also testing its WMA and is well below the resistance at line i.
- The OBV has formed lower lows, line j, which is also a negative sign.
- The 20-week EMA at $44.93 was tested this week.
- The weekly support, line g, is at $40.40 with the June low at $39.89.
What it Means: The recent data on Barclays PLC (BCS), along with the fact that both Credit Suisse Group (CS) and Deutsche Bank AG (DB) are lagging the overall market, makes them more vulnerable to a market decline.
The weekly studies could generate strong sell signals in the next few weeks, which would forecast a violation of more important support.
How to Profit: No new recommendation.


