It is a difficult environment as we end April and begin May, as risk has increased since the beginning of the year. A prudent approach favors raising cash; MoneyShow's Tom Aspray is confident that at the end of the inevitable correction, he will be buying.
The Dow Industrials looks ready to close higher for the fourth month in a row, even though it has been an a broad trading range for the past seven weeks, as has the S&P 500.
The most important test for the S&P came on April 18, when it dropped to a low of 1,536.03. But it closed for the day at 1,541.61, back above key support.
The ability of the market to hold these levels has taken the S&P 500 back to its recent highs. Furthermore, the strength of the market internals suggests the Dow Industrials, NYSE Composite, and S&P 500 can make further new highs, possibly even this week.
Of course, we start a certain new month this week. The flood of commentary on whether or not you should sell in May is already starting to flood in.
As a market timer, I have had good success taking advantage of short-term turning points. So I recommend raising cash when the market seems vulnerable and then look for a new entry point. This is often when the majority is selling, as was the case in December.
By February, I was looking for a correction, and I became more conservative. I prefer selling into strength, but I was also stopped out of some positions. Consequently, the cash in the model portfolio is around 65%, which is about as high as it normally gets.
But what action should you take if you are fully invested as you head into May?
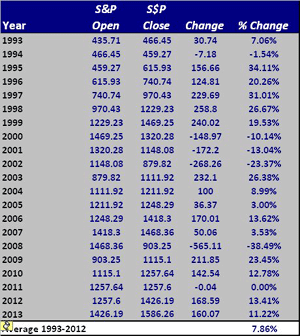
The table above shows the yearly performance of the S&P from 1993 through 2012, which averaged 7.86% (without dividends). I have also included this year's current gain of 11.22%. As I discussed a few weeks ago, there were spring corrections in each of the past three years, with the high for all of 2011 occurring on May 1.
Currently, the technical readings show no signs yet of a significant top, but they could generate new short-term sell signals before the end of May. I do think at least a 10% correction is likely over the next few months.
The longer-term outlook is still very positive, so there are no signs yet that the bull market is over. But if those short-term sell signals are generated, I will recommend inverse ETFs for the model portfolio.
To put the odds in you favor, I recommend that those who are fully invested reduce your equity exposure now by 20%. Sell another 20% on a move in the S&P 500 above 1,615. I would sell a further 20% on a daily close in the S&P 500 below 1,535.
This would leave you 40% in cash if the market moves higher, or 60% in cash if we get a drop below key support. This will leave you well prepared to buy at the next market low, and also lock in some good profits for the year.
NEXT: Global and Economic Strategy
|pagebreak|Last week, there were some signs that money was moving into the overseas markets. How they act on a pullback will tell us more. For Germany, this could just be an oversold bounce that will be followed by a further decline.
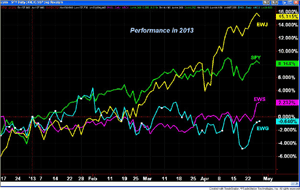
The 2013 performance chart shown below indicates that iShares MSCI Germany Fund (EWG, in blue) was up 4.8% on February 1, and is now down 0.68%. The iShares Singapore (EWS, in pink) has been negative for most of the year, but turned up last week.
Clearly the iShares MSCI Japan (EWJ, in yellow) has been the star performer, as it is currently up around 15.4%, leading the Spyder Trust (SPY, in green) by over 7%. I think that Japan may be a long-term bullish play, but it should also see a significant correction in the coming months.
I continue to think that the turnaround in China's economy has much further to go, even though every economic report that misses expectations tends to cause a short-term pullback. I am looking to get back into some of the China ETFs, after we were stopped out earlier in the year.
The focus this week is likely to shift back to the Eurozone. The European Central Bank (ECB) has to decide at the end of the week whether they will lower rates in reaction to the deteriorating economic conditions in several Euro countries. Germany seems to be holding firm against lower rates, so things could get nasty.
Returning to the US, the data last week on housing was pretty positive. This gave the housing stocks a boost, as they had retreated from their highs. However, the other economic news was not as positive.
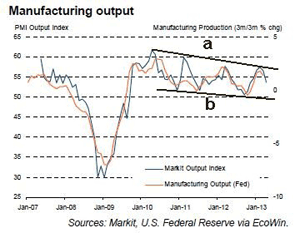
Durable goods dropped sharply, and the data on manufacturing was also disappointing. Both the Richmond and Kansas City Fed Manufacturing Survey declined, as did the widely watched flash PMI Manufacturing index, which dropped to 52 from 54.2.
The chart shows a pattern of lower highs (line a), which is not a good sign. A drop below 50 and the support (line b) would be more negative.
At the end of the week, the initial reading on first-quarter GDP was 2.5%, though the market was looking for 3.1%. The University of Michigan Consumer Sentiment was down to 76.4 from March's 78.4, but it improved from the preliminary reading of 72.3.
This is also a busy week for data. Pending Home Sales and the Dallas Manufacturing Survey are out on Monday. More manufacturing data follows on Tuesday with the Chicago PMI, as well as the S&P Case-Shiller Housing Price Index and Consumer Confidence. Also, the FOMC begins its meeting on Tuesday, with an announcement the following day.
Of course, the ADP Employment Report is also out on Wednesday, followed by the PMI Manufacturing Index and then the ISM Manufacturing Index. If the stock market survives all of these reports, jobless claims come out Thursday, and the monthly jobs report, Factory Orders, and ISM Non-Manufacturing Index round out the week on Friday.
Given the recent softening trend in some of the economic data, this list of reports makes it even more important that you review your portfolio this week, adjust stops, and consider taking some profits on your big winners if you have not done so already.
NEXT: What to Watch
|pagebreak|What to Watch
It was a mixed session for most of Friday.
The Dow was up for most of the day, while the S&P 500 and Nasdaq were moving
lower. The S&P 500 tried to make it back to positive territory, but closed
down.
The rebound this week was accompanied by strong market internals, which improved the market's tone. The decline Friday was consistent with Thursday afternoon's late sell-off in the major averages.
Many of the earnings reports have been stronger than expected, and several the tech names other than Apple (AAPL) had a good week. The earnings for Amazon.com (AMZN) were much weaker than expected, and the stock has dropped back to strong support.
If the market corrects only slightly for another day or so and then turn higher by the middle of the week, it will suggest new highs for the S&P 500, NYSE Composite, and the Dow Industrials.
According to AAII, the bullish sentiment moved a bit higher last week to 28.3%, with 38% bearish. If we do get a deeper correction in May, the number of bulls should drop back to the 20% level. The number of bullish financial newsletter writers has continued to drift lower; it is still quite high at 44.3%, but down from well over 50% a few weeks ago.
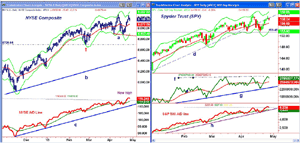
The NYSE Composite rallied back to its Starc- band on Thursday, and the bearish interpretation is that it is forming a double top. That would be confirmed by a close below 8,890 (line a).
There is next important support sits at 8,700, with downside targets from the double top in the 8,500 area. This corresponds to the uptrend (line b) that goes back to the June 2012 lows.
The significant new highs in the NYSE Advance/Decline last week make the double top less likely. It suggests we may just see a pullback to the 20-day EMA at 9,077 or the further support at 9,000.
The A/D line is still clearly in an uptrend, and is once again well above its WMA. I would expect to see a pattern of lower lows develop before a top is complete. Good support for the A/D waits at line c.
S&P 500
The daily chart of the Spyder
Trust (SPY)
looks pretty similar to the NYSE, as it has still failed to reach the quarterly
R1 at $160.31. There is first good support at $156.70, which is the rising
20-day EMA. The rally last week just briefly exceeded the former uptrend.
There is additional support now in the $156.80 area, and then at 154.50. The daily Starc- band is at 153.84, and major support sits at $153.45.
The daily on-balance volume (OBV) has turned down after slightly exceeding the March highs (line f). The WMA has turned up once more, and the OBV is well above stronger support (line g) that was tested on the last correction.
The S&P 500 A/D line also made new highs last week, and is acting stronger than prices. This is a bullish sign that generally means prices will also make new highs in the near future.
Dow Industrials
The SPDR Diamond Trust
(DIA)
was able to close the week with decent gains, and was one of the few indices
that was up Friday. The rally seems to be stalled in the $147.10 area. There is
monthly pivot resistance at $149.70, which would be a new high and close to the
15,000 level on the Dow.
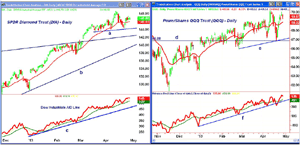
The daily Dow Industrials A/D line made further new highs last week, as it was also acting stronger than prices, though it does not look quite as good as the S&P 500 A/D. The A/D line's recent test of its rising WMA set up a good entry point. There is major support at line c.
The chart has minor support at $145.15 and then at $144.24 (line a). The monthly pivot is at $143.34.
Nasdaq-100
The PowerShares QQQ Trust (QQQ),
after recently violating the prior swing low at $67.19, had a good week, closing
up over 2%. Thursday's high at $70.05 was not far below the prior high at
$70.17.
The Nasdaq-100 A/D line violated its uptrend (line f) on April 18, but then reversed sharply, making new highs last week. It still looks positive, though a close below the recent lows would be a sign of weakness.
There is initial support at $66.92 and the rising 20-day EMA, with the monthly pivot at $68.19. There is much more important support now at $66.88 to $67.10.
NEXT: Sector Focus, Commodities, and Tom's Outlook
|pagebreak|Russell 2000
The iShares Russell 2000
Index (IWM,
chart below) has rebounded nicely from the recent lows at $89.13, as it was up
over 4%. It has still not surpassed the recent high at $94.67, which is needed
to confirm a new uptrend. The weekly Starc+ band stands at $98.59.
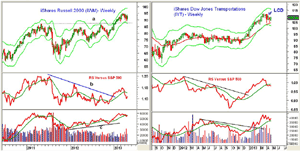
IWM closed the week back above the quarterly pivot at $91.50. There is more important support now at $89.13.
The relative performance turned up this week after breaking its long-term downtrend (line b) early in the year. The RS line now needs to move above its WMA. The weekly OBV is closer to moving back above its WMA, and the daily OBV (not shown) is above its WMA.
The Russell A/D line (not shown) has broken its short-term downtrend, which is a positive sign.
Sector Focus
The iShares Dow Jones
Transportation (IYT)
was up over 1% last week, after dropping close to its 20-week EMA twice in the
past month. The downtrend on the daily chart (not shown) is now at $109.80, with
the prior high at $110.50.
The relative performance confirmed the March high when a doji was formed. Two weeks later (see arrow), an LCD sell was triggered. The OBV has turned up from its WMA, and a higher close this week would make it look quite positive. There is key resistance at $111.62.
Five of the sector ETFs made new highs for the year last week. They were:
- Select Sector SPDR Health Care (XLV)
- Select Sector SPDR Consumer Discretionary (XLY)
- Select Sector SPDR Financials (XLF)
- Select Sector SPDR Consumer Staples (XLP)
- Select Sector SPDR Utilities (XLU)
In my recent article, 2013's Top Four Sectors, I liked four of the five, but thought XLF was ready for a further pullback.
The Select Sector SPDR Energy (XLE) rebounded nicely, up 3.3%, and the Select Sector SPDR Materials (XLB) was also up over 3%. Even the lagging Select Sector SPDR Technology (XLK), was able to gain 2.4% for the week.
Interest Rates
The yields on both the ten-year T-Note and
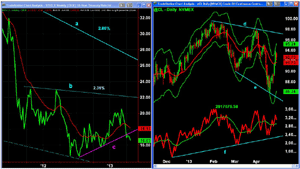
30-year T-Bond fell last week, as the uptrend in yields on the ten-year (line c)
has been decisively broken. It goes back to last summer's lows.
The next key support is in the 1.56% area, which if broken will signal a test of the July 2012 lows.
Declining yields were one of the warning signs, along with collapsing gold prices and weak crude oil prices. They are not normally consistent with a strong stock market, as it implies more investors are moving to safe assets. The bond pros are also nervous.
Crude Oil
Crude oil was sharply higher last week, as the
June contract gained more than $5 per barrel. Prices moved from the daily Starc-
band to the Starc+ band in just five days. Crude still shows a pattern of lower
highs (line d). The June contract needs a close back above $97.50 to break the
downtrend.
Crude oil has also made lower lows (line e), but the OBV has not. The OBV is still well above its uptrend (line f), so clearly the technical picture here is mixed.
Precious Metals
The June gold contract also came back,
but after the extent of the sell-off it is not surprising. It gained more than
$50 for the week.
The Spyder Gold Trust (GLD) was also up over 4%, but severe technical damage has been done. I took a look at the Most Oversold Gold Miners last week, and all still look weak technically, so the rebounds should fail.
The Week Ahead
As I said last time, "The S&P 500 and
Dow Industrials, which are the strongest averages, need several consecutive
higher closes to turn the focus back on the upside."
While the short-term technical picture has improved, if the market takes a hit early next week, that could change the momentum. With the flood of data, this is going to be a volatile week, and is likely to be a tough week to buy.
We did buy one retail stock near the lows of last week, and it is acting well, but there are not too many buy candidates out there. In this environment, I think a higher than average cash level is a good idea.
- Don't forget to read Tom's latest Trading Lesson, A Candle Trigger for Market Tops

