Just because the market keeps posting one all-time high after another doesn't mean the end is near, and MoneyShow's Tom Aspray explores whether the same can be said of this top-performing sector.
The 40% jump in earnings from Bank of America (BAC) set the tone for stocks on Wednesday as the market put in a strong performance. All of the major averages logged solid gains and the 2 to 1 positive A/D ratios have pushed the NYSE Advance/Decline to new highs.
The previously lagging OBV indicators have also improved so those averages that have not yet broken out to the upside should in the next week. For the Spyder Trust (SPY), the next upside targets are in the $187.50-$188.50 area. The market-leading PowerShares QQQ Trust (QQQ) has already closed above the recent highs with monthly projected pivot resistance at $90.57. This is 2.5% above Wednesday's close.
Over the next few weeks, many of the biggest names in every sector will report their earnings so the earnings trend could have an important impact on the technical outlook for the sectors. One sector I am watching closely is healthcare.
In early December, there were signs that it was forming a short-term top and the Sector Select Health Care (XLV) did have a three-week 4% correction but has again surged to new highs in 2014. It is the best performer, so far in 2014, gaining 2.7%. But can the earnings from the big healthcare companies push this sector even higher?
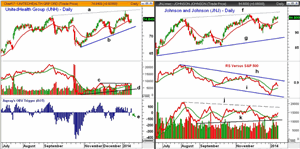
Chart Analysis: UnitedHealth Group Inc. (UNH) reported before the opening that its 4th quarter income rose 15% as the number of enrollments continues to rise. The stock is being hit hard before the opening as it is down over 2%.
- The daily chart shows that UNH tested its 20-day EMA over the past three days
and closed strong on Wednesday's close.
- There is minor support now at $73.68 and the monthly
pivot with stronger in the $71.80-$72.50 area.
- The daily OBV is on the verge of breaking through the
resistance at line c.
- The uptrend in the OBV is not as strong as prices.
- Aspray's OBV Trigger (AOT) was negative on Monday but
flipped back to positive Tuesday.
- The next resistance is at $76.20 to $77.33 with the
monthly projected pivot resistance at $79.02
The action of Johnson and Johnson (JNJ) was one of the Dow's most overbought stocks at the end of November. It peaked on November 25 at $95.99 and had dropped 6.4% by the middle of December. They report earnings on January 21 and XLV has over 12% in JNJ.
- JNJ has been strong this month as it has already
exceeded its monthly projected pivot resistance at $94.33.
- There is trend line resistance at $96.66 with the
weekly starc+ band at $97.64.
- The daily relative performance has moved back above its WMA but is still well below its downtrend,
line h.
- The lower lows in the RS, line i, is not consistent
with a market-leading stock.
- The daily OBV tested important support at the start
of the year, line k, before turning higher.
- The OBV moved back above its WMA on January 6.
- There is minor support at $92.50-$93 and the
quarterly pivot at $90.83 was tested at the start of the year.
NEXT PAGE: 2 Healthcare Stocks Reporting Earnings
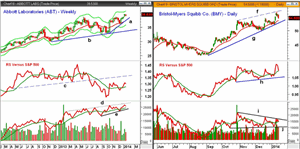
|pagebreak|Abbott Laboratories (ABT) has been up over 20% in each of the past three years. It gapped above the 2013 high at $38.59 on the third trading day of 2014. It reports earnings on January 22.
- The monthly pivot resistance is at $39.81 with the weekly starc+ band at $40.83.
- The weekly chart shows that the December correction
held the rising 20-week EMA.
- The short-term uptrend, line a, is now at $37.63,
which is just above the monthly pivot at $37.52.
- There is major support in the $33.70-$32.70 area,
line b.
- The weekly relative performance broke major support
at line c last summer.
- The RS line is back above its WMA but still well
below the long-term resistance.
- The weekly OBV dropped below its WMA for two weeks in
early December before it flipped back to positive.
- The OBV did make a marginal new high last week with
key support now at line e.
Bristol-Myers Squibb (BMY) made a new all-time high on Monday at $56.83, which was just below the monthly pivot resistance at $56.96. BMY was very strong in 2013 as it was up 68.5% after losing 3.6% in 2012. It reports earnings on January 24.
- The daily chart shows a potentially bearish rising
wedge formation, lines f and g.
- A drop below the recent low at $52.14 would be the
first sign of weakness with the quarterly pivot at $51.24.
- There is monthly chart support now in the $50 area.
- The daily relative performance spiked to new highs
this week before reversing.
- A drop in the RS line below the support, line h,
would be a sign of weakness.
- The daily OBV has formed a pattern of lower highs,
line i, and has been diverging from prices
- There is key daily OBV support now at line j.
- The weekly OBV (not shown) is still above it rising
WMA.
What It Means: Of these four stocks, UnitedHealth Group Inc. (UNH) looked the most attractive over the short term but the action early Thursday reminded investors that even good earnings do not always push stocks higher.
The relative performance analysis of both Johnson and Johnson (JNJ) and Abbott Laboratories (ABT) indicates they are not currently leading the market higher.
The technical outlook for the healthcare sector is positive and suggests that it can still move higher in reaction to earnings. However, it is the favorite sector of most analysts, which makes me nervous. I am sticking with longs in the Sector Select Health Care (XLV) as long as it does not have a weekly close below the quarterly pivot.
How to Profit: No new recommendation.


