Overbought conditions and apparent reversals in major stock indices suggest the start of a long-overdue correction. Here are the key support levels to watch across the major averages.
The deterioration last week in some of the short-term technical studies like the McClellan Oscillator was consistent with a weakening stock market.
Prices continued to move higher early this week, led by Apple Inc. (AAPL) and the Nasdaq 100. Since the December lows, the PowerShares QQQ Trust (QQQ), which tracks the Nasdaq 100, is up 17.8% versus a 13.2% gain in the Spyder Trust (SPY).
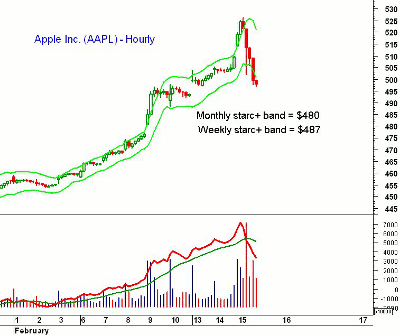
As I noted on Tuesday, many of the Nasdaq 100 stocks were at highly overbought levels based on my Starc band analysis, and AAPL was near the top of that list.
The hourly chart of AAPL above shows that it surged to a high of $526.29 early Wednesday, but then weakened around lunch time and was hit with heavy selling, as hourly volume topped 14 million shares. The daily high was well above both the weekly and monthly Starc bands.
The reversals in the major averages are consistent with the start of the long-overdue correction. Though another marginal new high is still possible over the near term, the market internals suggest stocks are likely to drop as we head into the end of the month. Therefore, it is important to identify the key support levels and watch them closely.
NEXT: Important Support Levels for Nasdaq, S&P 500
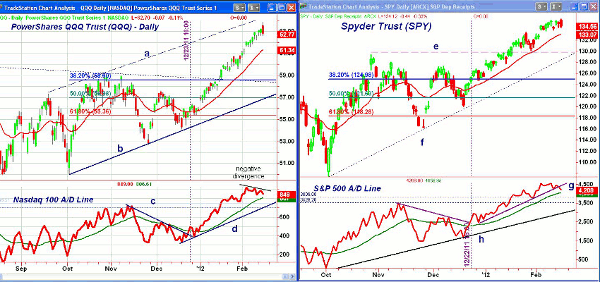
|pagebreak|Chart Analysis: The chart of the PowerShares QQQ Trust (QQQ) came very close to the upper parallel trend line (line a) on Wednesday. There is now short-term support in the $62 area with the rising 20-day exponential moving average (EMA) at $61.34.
- From the October low of $50.10, the 38.2% Fibonacci retracement support level is at $58.60, which corresponds to the late-October highs
- The more important 50% support is at $56.98 along with the daily uptrend, line b
- The Nasdaq 100 Advance/Decline (A/D) line peaked on February 3 and has since formed lower highs. The negative divergence is consistent with a short-term top
- The A/D line is still above its rising weighted moving average (WMA) but could decline to converging support (lines c and d)
- On the upside, there is a Fibonacci price target at $67.15
The Spyder Trust (SPY) had a wide range Wednesday and closed lower. The next support is at $133.40, which corresponds to the late-January highs, while the 20-day EMA is just above $133.
- There is more important support in the $130 area, line e. This would correspond to a further decline of 3.4% from Wednesday’s close
- There is additional chart support in the $127-$128 area with the 200-day moving average (MA) at $125.92
- The 38.2% Fibonacci retracement support from the October lows is at $124.98 which is 7.1% below current levels
- The 50% support is at $121.68
- The S&P 500 A/D line has broken its short-term uptrend, line g, suggesting it will drop below its rising weighted moving average. This reverses the positive signal from December 22 (noted on chart)
- There is first good support for the A/D line at the November highs and then at the longer-term uptrend, line h
- The long-term monthly chart for SPY shows the 78.6% resistance at $138.26
NEXT: Even Past Leaders Like Dow, Russell 2000 Are Showing Weakness
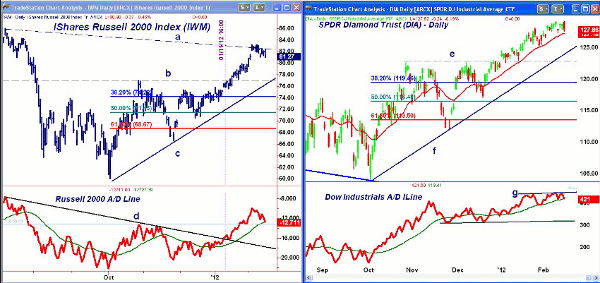
|pagebreak|An article in The New York Times on Tuesday noted the outperformance of the small-cap stocks, as tracked by the iShares Russell 2000 Index Fund (IWM), but this was a bit late since the RS analysis has looked positive since December (see “Bearish Sentiment May Boost Small Caps”). The long-term downtrend from the 2011 highs, line a, was tested last week. It is currently in the $83 area.
- First strong support for IWM is in the $77 area, line b
- The 38.2% Fibonacci support from the October lows is at $74.28 with the 50% support at $71.15
- The Russell 2000 A/D line has dropped back to its rising weighted moving average and is already back to support at the November highs
- There is longer-term support now at line d
- Initial resistance is now at $83.22 with stronger resistance above $84
The SPDR Diamonds Trust (DIA), which led the market higher since the October lows, has been lagging since December. There is next support at $127 and the 20-day EMA.
- There is additional chart support in the $125 area with the November highs, line e, at $122.80. A drop to this level would mean a further decline of 3.9%
- The 38.2% Fibonacci support is at $119.46 with the 50% retracement support at $116.48
- The Dow Industrials’ A/D line has failed to make significant new highs over the past few weeks, which is consistent with a weakening rally
- The A/D line is now testing its weighted moving average and has important support at the December lows
- There is resistance at the 2011 highs of $128.63 and then last week’s high at $129.12
What It Means: Stock index futures are lower in pre-trading and a lower close Thursday will further confirm a short-term top. If we instead close higher, it will leave the door open for a test of the week’s highs as part of the topping process.
I have been looking for a 3%-5% correction that could take the Spyder Trust (SPY) back to the $128-$130 area. Bullish sentiment spiked this week with over 54% of the newsletter writers now bullish, but the American Association of Individual Investors (AAII) sentiment survey as of February 16 revealed a drop of 9%. SPY may even begin a deeper decline to the $126 area, which would mark a decline of 6.4%.
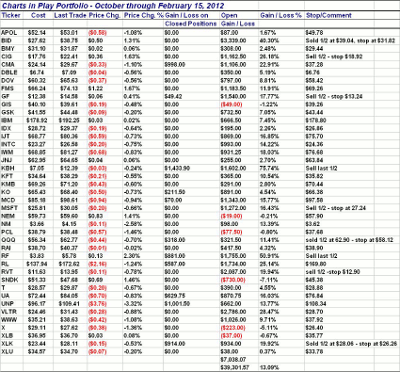
How to Profit: Over the past few weeks, I have been recommending that investors take profits, raise stop levels, and avoid any aggressive buying (see “Don’t Wait to Control Risk”). I have further updated the stops on my previous recommendations and hope you have a plan in place for each stock in your portfolio before we see heavier selling.
NEXT: See Complete Portfolio and Updated Stop Levels
|pagebreak|Charts in Play Potrfolio with Updated Stop Levels


