Welcome to the first MoneyShow Chart of the Week article of 2025! I hope you’ve enjoyed the 2025 Top Picks Report digests and details I’ve been sending you in the meantime (and if you haven’t yet downloaded your full report copy yet, you can do so HERE.)
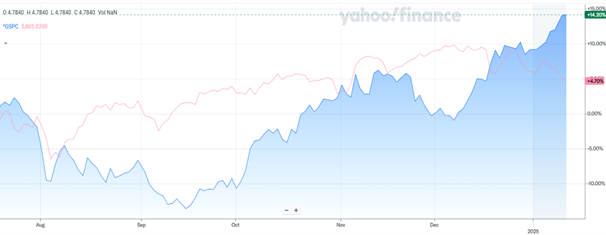
Identifying the most important thing on Wall Street’s mind right now is simple. It’s interest rates! Just look at this week’s chart comparing the change in the S&P 500 (in red) to the yield on the 10-year Treasury Note (in blue):
S&P 500 vs. 10-Year Treasury Yield (6-Mo. % Change)
Source: Yahoo Finance
The stock market could INITIALLY deal with rising rates, as we saw from August through mid-December. But then rates began violating my “Three ‘F’ Rule.” They rose Far enough, Fast enough, and For long enough to start “mattering” to equities! And the S&P began to roll over.
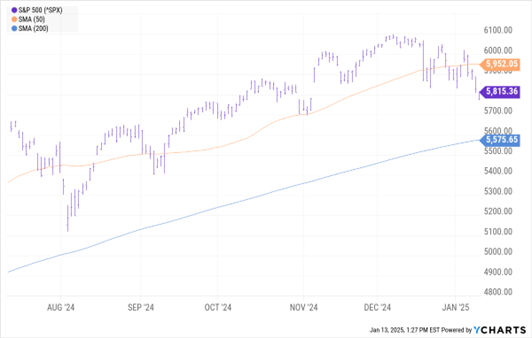
We haven’t violated any major long-term uptrends yet. In fact, we’re simply testing the post-election “gap” up in the market from early November, as you can see in this bonus chart.
S&P 500 Index (6-Mo. Chart)
Data by YCharts
But I will definitely be watching closely what happens in the next week or two. We have key inflation data looming, not to mention a Federal Reserve meeting later in the month. How markets handle that new information will say a lot about what to expect in the rest of Q1.


