
I like September for a lot of reasons. Professional football starts back up. The weather starts to cool. You can pretty much find pumpkin spice “everything” again.
But for investors? It’s not great. Not by a long shot.
Here’s a double dose of charts in this week’s MoneyShow Chart of the Week column – from two of the top firms who contribute to MoneyShow events. The first is from CFRA Research and the second is from Yardeni Research.
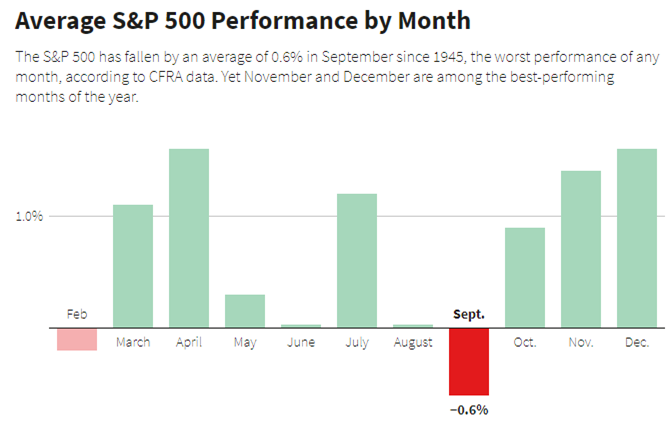
Source: CFRA Research
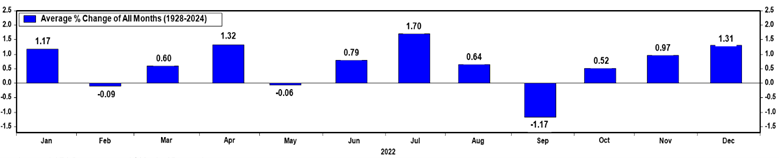
Source: Yardeni Research
The good news? If you can make it through this month without selling your stocks and running for the hills, you have something to look forward to! November (+1.4% / +0.97%) and December (+1.6% / +1.31%) are two of the strongest months for stocks, seasonally speaking.
Bottom line as far as I’m concerned? Even in this “Be Bold” environment, we could be in for a rough patch. Just remember that it doesn’t change the big picture. Falling interest rates, a soft landing in the economy, still-solid corporate earnings growth, and a broadening out of the market advance are all bullish in my book!


