Long-term positions in energy ETFs like USO and UNG are vulnerable to the "contango" effect, says energy expert Cynthia Kase, while short-term positions don't exhibit the same tracking issues.
Many traders are comfortable trading ETFs because they trade like stocks, so if you want to trade energy, ETFs might be a good way to go, but there are some correlation issues you need to be aware of in terms of ETFs correlated to futures.
Our guest today is Cynthia Kase to talk about that. So, Cynthia, talk about the correlation issues between the ETFs and futures and the futures contract itself.
Well, the two ETFs I’ve looked at are the United States Natural Gas Fund (UNG) and the United States Oil Fund (USO), and the question is really two-fold.
Number one, would I like to trade an ETF? Is that something I want to do, because I can trade small volume and my risk is lower, of course, if my volume is lower?
The second question is if I trade an ETF, will I get a simulation that tracks and follows crude oil or nat gas? The answer is maybe, depending.
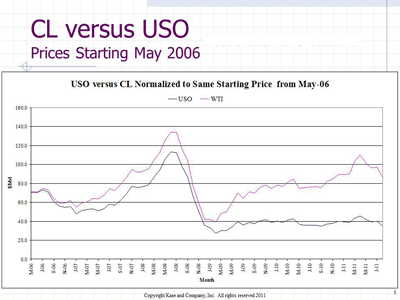
So, I have a chart here where I made the crude oil and USO contract to start out at the same price from the beginning at an arbitrary date, May 1, 2006. Just by definition, the chart shows them starting out at the same price.
Not long after that, three or four months after that, the prices diverge. Just looking at the chart, the difference may not seem that extreme, but if one keeps in mind that the scale of the chart is from $0 to $140, the scale of the chart somewhat dampens the visual importance of the difference.
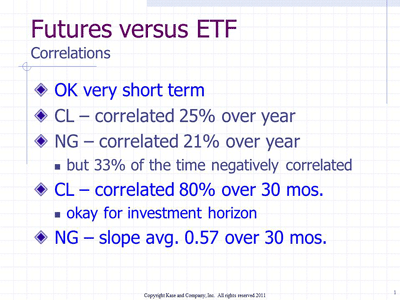
I did some very detailed statistical analysis of the ETFs versus crude and gas, and what I found was is that if you’re going to trade very short term, the correlations work very well.
So, for example, if I’m trading a 15-minute chart or an hourly chart, and I just want to trade a much smaller volume, and I make sure that I’m trading within a rollover window—that is, after a rollover and expiration of one contract and before the expiration of the next one—it works out OK.
If I wanted to trade longer term, the correlation of crude oil over one year versus USO only correlates—when we say correlates, we mean that if we look at the slope, it’s between 80% and 120%—it only correlates 25% of the time.
Nat gas only correlated 21% of the time, which means, of course, that 79% of the time it wasn’t correlated, and of the 79% that wasn’t correlated, 33% of all the observations were negatively correlated.
NEXT: Final Conclusions for Both ETFs
|pagebreak|So, it sounds like on a shorter-term basis, it’s a good proxy; long term, it’s not.
Right. Bottom line, we also looked at the correlations over 30 months. Crude oil was correlated 80% of the time, and natural gas, unfortunately, was never correlated over any 30-month period. We looked at a rolling 30-month period over the past two years.
So, my conclusion from this is for real short-term trading, it’s OK.
Crude oil, if you are an investor and you want to hold crude oil, and you’re committed to holding it for 30 months or longer, crude oil has a reasonable correlation.
For natural gas, at this point, with the data that I have, I wouldn’t recommend long-term investments in natural gas based on ETFs unless you’re investing in the ETF as an instrument on its own without expecting a correlation with the natural gas.
Related Reading:


