

We FINALLY saw volatility take off on Friday. The CBOE Volatility Index (VIX) almost doubled to more than 45 after markets took a second tariff-related dive.
This MoneyShow Chart of the Day shows the recent action – and how we haven’t seen anything like it since last August. Back then, worries about the yen carry trade unwinding fueled a massive, but short-lived, spike.

Source: StockCharts.com
Steve Sosnick is chief strategist at Interactive Brokers, and he did an excellent job explaining how the VIX works and why it matters in a keynote at the 2025 MoneyShow Las Vegas. You can check that briefing out HERE on our MoneyShow YouTube Channel.
For our purposes, it’s worth looking at what a 45+ VIX has “meant” for markets in the past. The index doesn’t get that high very often…and when it does, it tends to mark a short-term bottom. Check out this table from @SubuTrade on X:
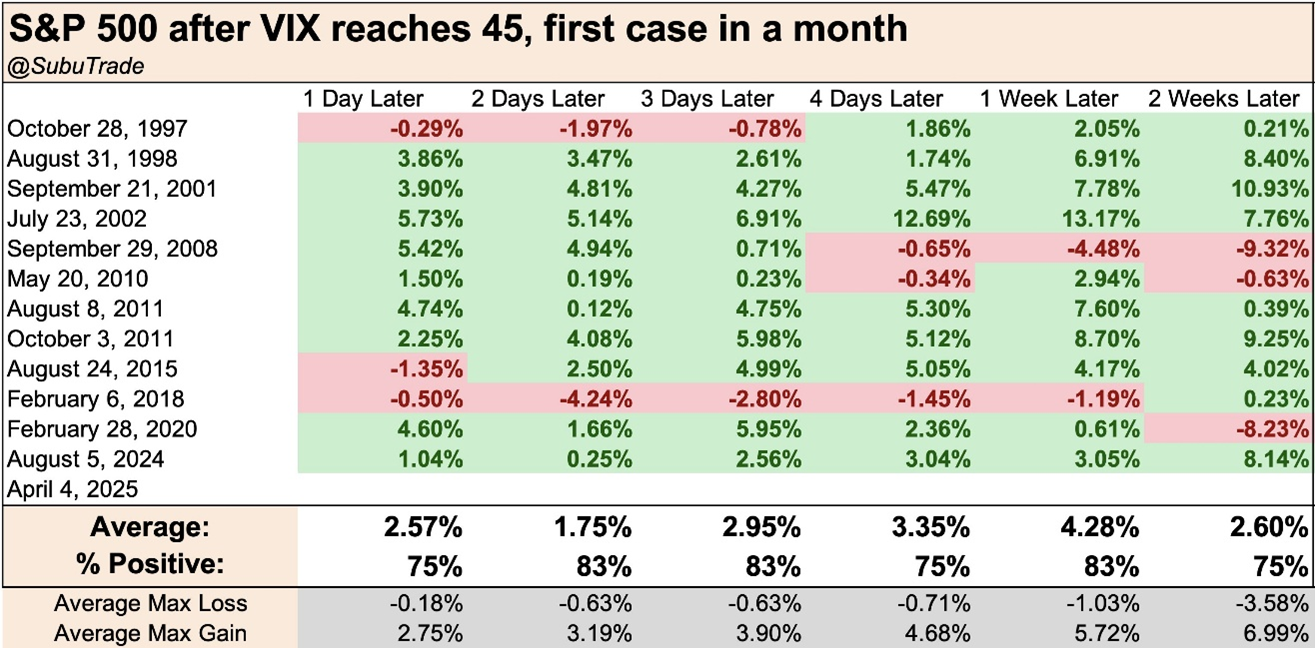
Source: @SubuTrade on X
Going back to the late-1990s, when the S&P 500 topped 45, it traded higher over the next two weeks 75% of the time. Its average gain during those periods was 2.6%. Probabilities were in your favor as a trader over shorter-term timeframes, too.
The only times things really moved against you were during the Great Financial Crisis in September-October 2008 and the depths of the Covid-19 pandemic in February-March 2020. Had you bought the move above 45 in VIX then, you would have been down 9.3% and 8.2% a couple weeks later, respectively.
I can’t guarantee this selloff is over. I can’t guarantee volatility is done spiking. But when there’s panic in the air, it often (but not always) signals that it’s time to buy.


