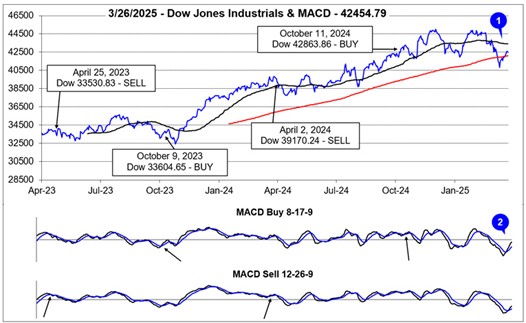
If this level of uncertainty persists, the market will be hard pressed to make any significant headway. Technically, the S&P 500 (SPX) and Dow Jones Industrial Average have some work to do to find support for any sustainable tradable rally to take hold, highlights Jeff Hirsch, editor-in-chief of The Stock Trader’s Almanac.
We have highlighted in yellow this area of resistance between the old July highs and the orange circle election gap breakout roughly between 5,670 and 5,775. S&P closed recently at 5,693.31. The 200-day MA (curvy blue line) is also proving formidable at 5,756.
![[S&P 500 Technical Support Levels Chart]](https://msgraphics.blob.core.windows.net/content/article-img/tradingidea63868.jpg)
We have added a new trend line from the April 2024 low to the August 2024 low that extends up toward the recent March 2025 low around 5,500, circled in red. If the market tests and holds the March lows and then rallies though the 5,775 resistance, we would have ourselves the makings of a potential “W-1-2-3” Swing Bottom.
This would be quite constructive and increase the odds of the market shaking off this malaise and put our Base Case Scenario of 8%-12% gains for 2025 back in play. Until then, we remain cautious.
For the Dow, its rebound from its March closing low lifted it back above its key 200-day moving average (1) and trimmed its decline nearly in half, but the bounce has come under pressure in recent trading sessions. The Dow’s bounce has turned its slower- and faster-moving MACD indicators positive (2) but they are beginning to confirm the recent loss of momentum.

Since registering its first Down Friday/Down Monday (DF/DM) of 2025, the Dow has declined in four of seven weeks. Three of the weekly declines exceeded 1,000 points. As gloomy as this seems, its recent record is actually better than S&P 500 and Nasdaq, as both declined in five of the last seven weeks.


