

Did you get a load of the latest consumer confidence figures? Woof!
The Conference Board’s Consumer Confidence Index tanked 7.2 points to 92.9 in March. That was the fourth decline in a row. Worse, a subindex that tracks expectations about the future slumped to its lowest in 12 years. That reading came in at 65.2 – well below the 80 level typically associated with potential recessions.
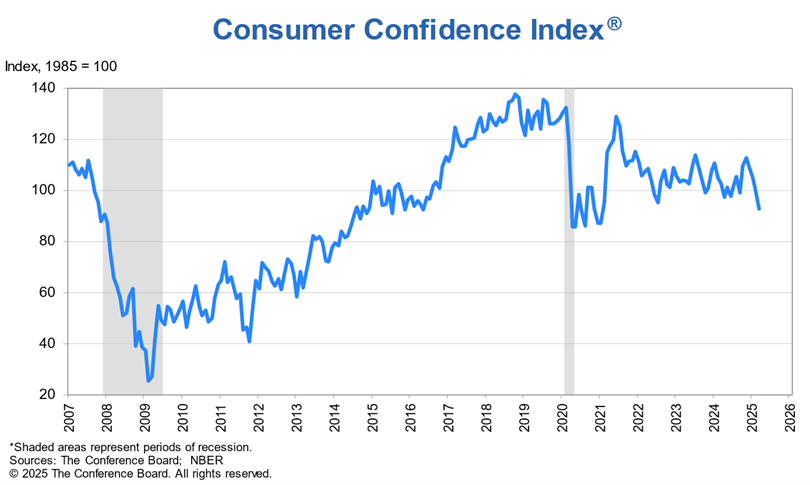
But it’s just survey data…right? People saying they’re gloomy…but still spending money?
Well, that’s where the MoneyShow Chart of the Day comes in. It shows the SPDR S&P Retail ETF (XRT) and how it has performed over the last half-decade. You can see that it doesn’t look much different from the chart of the confidence index over the last few years. It’s down 11% year-to-date and 6.4% in the last 12 months.
SPDR S&P Retail ETF (XRT)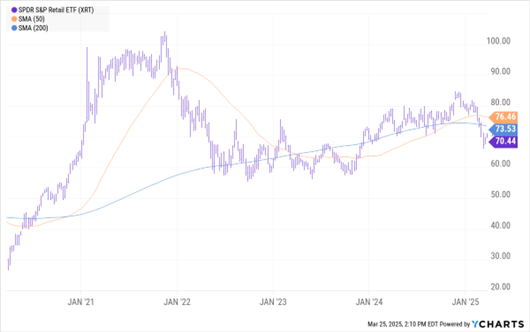
Data by YCharts
Why focus on the XRT? The fund owns a wide range of general retailers, plus those selling everything from sporting goods and groceries to clothing and auto parts. Holdings include Walmart Inc. (WMT), Costco Wholesale Corp. (COST), Academy Sports and Outdoors Inc. (ASO), Sprouts Farmers Market Inc. (SFM), and O’Reilly Automotive Inc. (ORLY).
That makes it much more diversified – and not top-heavy like the VanEck Retail ETF (RTH). That fund has a 20.5% weighting in Amazon.com Inc. (AMZN), with the next four companies accounting for another 30%. But even the RTH is showing middling performance. It’s slightly outperforming the S&P 500 YTD with a 1% rise…but underperforming the S&P in the last 12 months with only a 9% gain.
Bottom line? It’s hard to explain away the data – OR the charts. Consumer confidence isn’t great. Nor is the performance of companies most levered to consumer spending.


