

Every once in a while, I’ll see a chart that begs a simple question: “If you didn't know what this stock or fund was, would you buy it?” That was the case recently with the iShares 20+ Year Treasury Bond ETF (TLT).
Let’s be honest. It’s easy to make a case AGAINST US Treasuries. The potential inflationary impact of tariffs. The risk foreign holders will dump US bonds. The exploding US budget deficit and debt load. Worries the Federal Reserve will get policy wrong. The list goes on and on.
Yet I’ve noted in columns and comments on social media that from a TECHNICAL perspective, there’s a lot to like. Or in plain English: If you saw this “Mystery” MoneyShow Chart of the Day below -- without a name or ticker at the top – would you hit the “Buy” or “Sell” button?
Mystery Fund: Buy or Sell?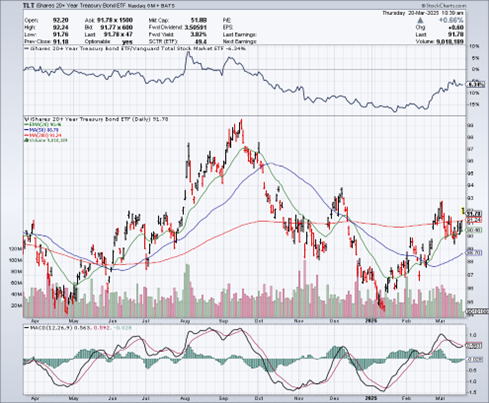
The answer is “Buy”...right? You have a nasty washout low on heavy volume, followed by positive price action. That includes a couple of gap ups, with subsequent, successful retests.
You also have short-term (20-day) and intermediate-term (50-day) moving averages turning up. MACD has been mostly supportive. And now, it looks like TLT could mount an assault on the $93 area – something that would signal a powerful breakout if it happens.
So, sure. There are plenty of cogent, rational-sounding reasons to avoid Treasuries. But when it comes to the chart, what’s the message it’s sending? You know my answer.


