
The S&P 500 fell right to the 10%-down mark, then rebounded. Here are three ETF charts I’m watching to determine where we go next, says Robert Isbitts, founder of Sungarden Investment Publishing.
The plot thickens. And so should our skin. The only reason I have not moved toward zero on my Reward Opportunity and Risk (ROAR) score is that this bull market has been the most resilient of our lives. “Buy the dip” might not be done, even if the hourglass is running out of sand. We've been here before.
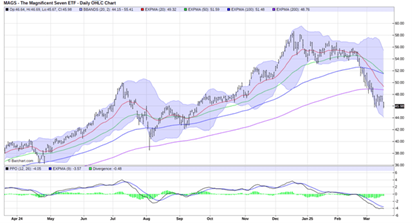
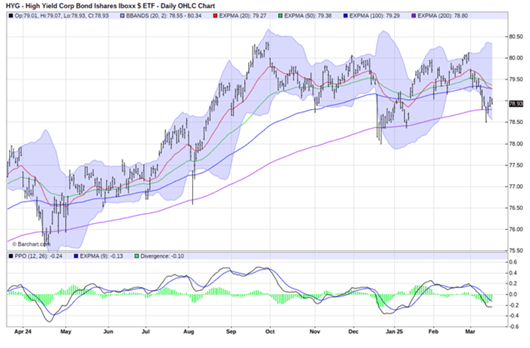
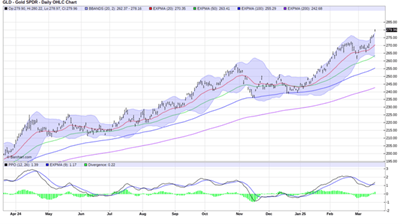
But as always, I separate what I “think” should happen (deep further drop in major market indexes) from considering all conceivable scenarios. Now, let’s get to those charts – the iShares iBoxx USD High Yield Corporate Bond ETF (HYG), the SPDR Gold Shares ETF (GLD), and the Roundhill Magnificent Seven ETF (MAGS).
It's not a true “crisis” until high yield bond spreads break out (widen) and HYG falls hard. Not yet.
Gold continues higher, unabated. Impressive and concerning at the same time.
We are one or two more bad days from the Mag 7 stocks risking a decline that could make us forget about what's already happened. So far, it's a “correction,” but another big leg down and it looks more like a bubble busting. Stay tuned.