

Traders and Investors have so many questions right now about the coming months and quarters. A big theme on a conference call I just hosted was the massive rotation that we're seeing underneath the surface, highlights JC Parets, founder of AllStarCharts.
I don't mean to be mister diagonal trendline guy, but this is worth watching. I think this right here is part of the reason why investors are so pessimistic, particularly American ones.
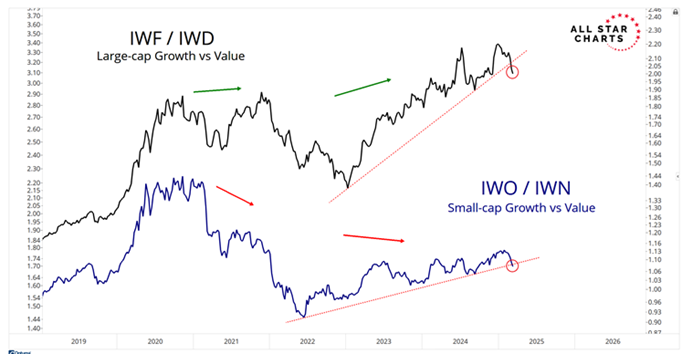
They own way too much of the growth stocks represented here by the iShares 1000 Growth ETF (IWF) and iShares Russell 2000 Growth ETF (IWO), and nowhere near enough of the other stuff represented by the iShares Russell 1000 Value ETF (IWD) and iShares Russell 2000 Value ETF (IWN).
This is most likely due to the combination of recency bias (Growth has been the biggest winner for a while now) and of course their home country bias (the US has been the best place to be invested in for a while now).
Meanwhile, the S&P 500 closed at a new all-time high less than two weeks ago. So, did the Nasdaq. But despite all of that, individual investors are the most bearish they've been since the market literally bottomed back in 2022:
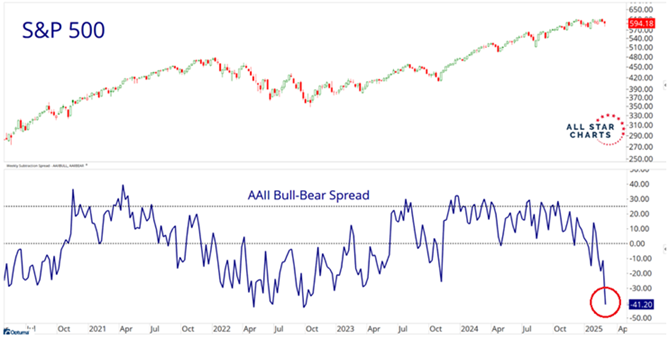
As a reminder, at the market lows back in 2022 (the last time sentiment was this pessimistic) economists were pricing in a 100% chance of recession. We all know how that turned out: We had two of the greatest back-to-back years for US stocks in American history. Thank you economists!
And so here we are, with the major US indices just a few points from all-time highs. Plus, many of the other major stock indices around the world all still hitting new all-time highs (more of them actually than at any other point this entire bull market).
It's been all about rotation.


