

Now that a pullback in US stock markets has begun, where will it end? The answer can be found by examining the current market trend in different time frames, writes Ian Murphy, founder of Murphy Trading.
We already know the daily chart of the S&P 500 is heading south from our Composite Indicator and help strategy positions as discussed recently. So, let’s take a step back and look at the weekly chart.
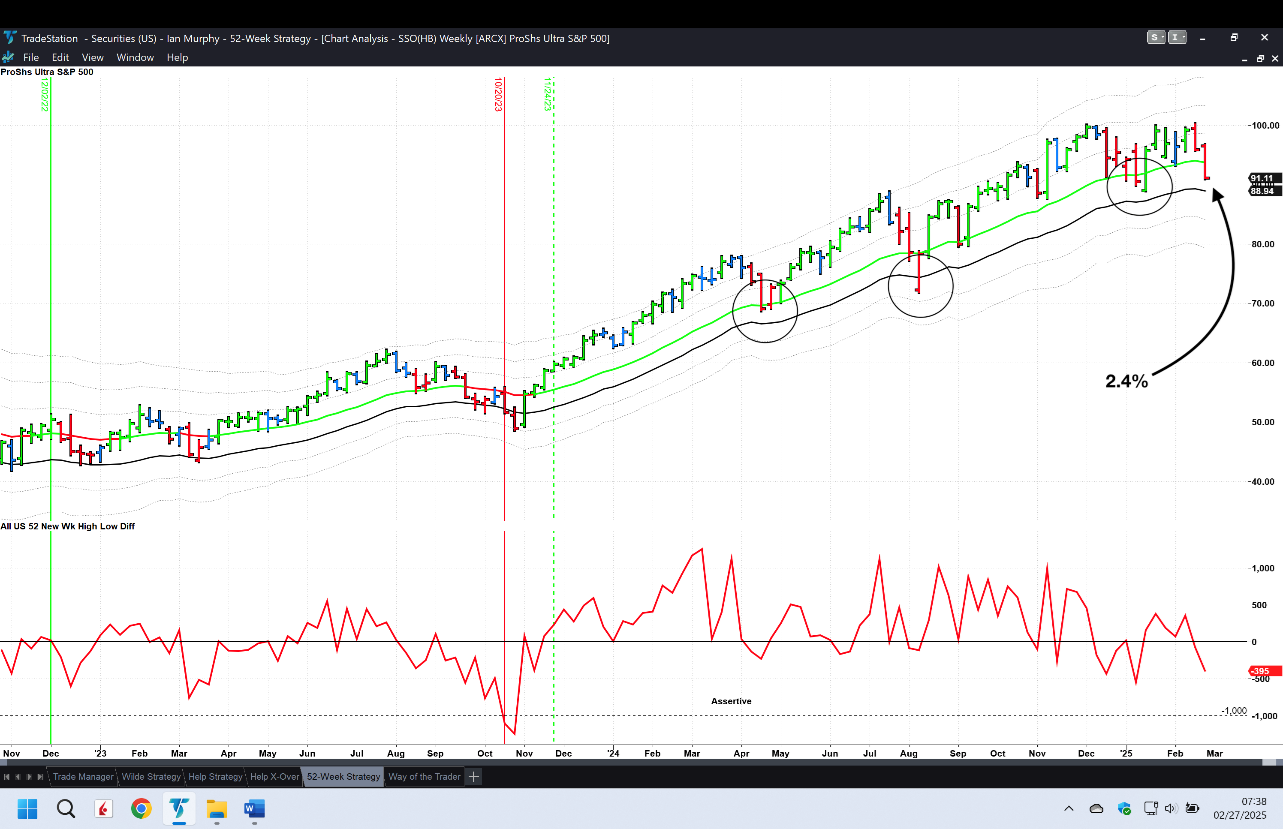
Our 52-week strategy has had an open position since November 24 last year as the bull market remained in force, but that may be changing now. We have had regular pullbacks along the way (circles), and the current selloff may be no different. Let’s wait and see!
For the ProShares Ultra S&P500 2X Shares (SSO) ETF to close below its soft trailing stop on Friday, it would have taken an additional decline of 2.4% (arrow). Considering that would only be 1.2% on the S&P 500 (because this moves twice as much), it’s not outside the bounds of possibility that this level will break soon.
If you’re holding this position (or any other weekly trend-following position for that matter), this is a time to sit up and take notice!


