

Trading should be simple. Follow trusty time-tested indicators and call it a day. Right now, markets are making new highs, stunning the crowd. One big reason is the hidden bullish breadth in technology stocks – and ETFs like the Technology Select Sector SPDR Fund (XLK), highlights Lucas Downey, co-founder of MapSignals.
Let’s rewind the tape. Just two short months ago, stocks were sold with abandon. Fedspeak caused many investors to second-guess the merry-go-round path of interest rates.
But our data signaled a massive buy signal that rarely comes along. Capitulation is one of the best times to strap on the helmet…and get in there. When the crowd is cryin’…start buyin’.
Today, we’ll size up the money flows picture and illustrate the powerful hidden breadth in technology stocks. When the money flow backdrop is strong, dive below the surface. Unlock the hidden catalyst.
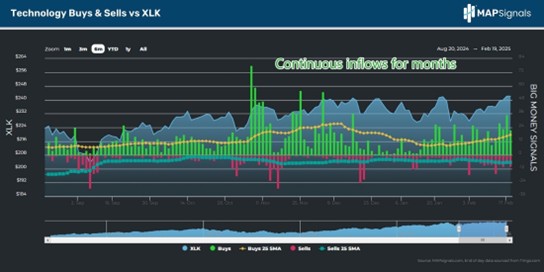
Below is a snapshot of our inflows and outflows in our technology stock universe. I want to draw your attention to two facts:
- First, note how mid-December saw red bars, indicating selling
- Second, and most important, see how those red bars vanished, indicating that buy demand swooped in to tame the selloff
Money flows are important because they can often give a differing picture than other popular breadth indicators. A case in point is the following graphic.
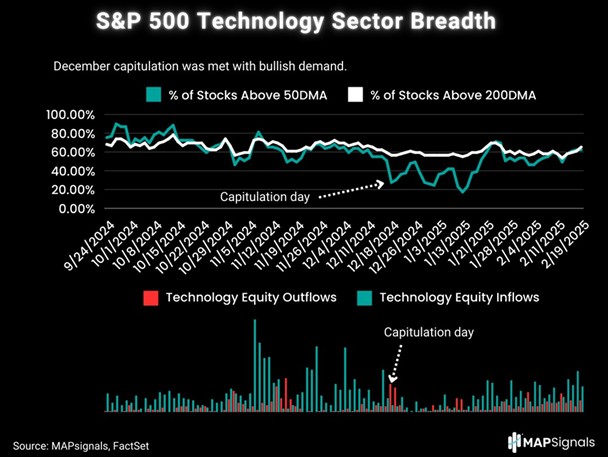
Here, I’ve plotted on top the 50 dma and 200 dma of the constituents of the S&P 500 technology sector.
It reveals how the 50 dma breadth was declining and stayed muted for over a month beginning near the capitulation event in December.
What the MAPsignals data on bottom spotlights is that capitulation came and vanished days later. Buy pressure met the outflows, creating a bottoming signal.
A vanishing of selling…is bullish. Looking back, it can be difficult to forecast the future. That said, we have been convinced the evidence painted a very constructive picture. One that rarely comes along.


