

The S&P 500 and Nasdaq made new highs. Only six of the eleven S&P SPDR sectors finished higher last week, notes Bonnie Gortler.
Consumer Discretionary (XLY) and Technology (XLK) were the strongest, while Healthcare (XLV) and Energy (XLE) were the weakest. The SPDR S&P 500 ETF Trust (SPY) gained +1.91%.
S&P SPDR Sector ETFs Performance Summary 6/28/24-7/5/24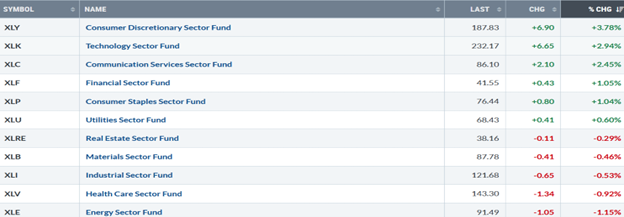
Source: Stockcharts.com
Figure 2: Bonnie’s ETFs Watch List Performance Summary 6/28/24-7/5/24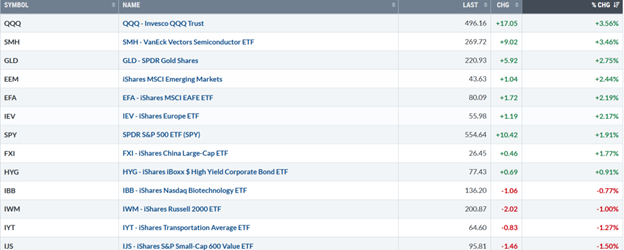
Source: Stockcharts.com
Technology and Semiconductors led the advance. Gold, Emerging Markets, and Europe outperformed the S&P 500. Small-cap growth and Small Value, Transports, and Biotechnology moved lower.
Figure 3: UST 10YR Bond Yields Daily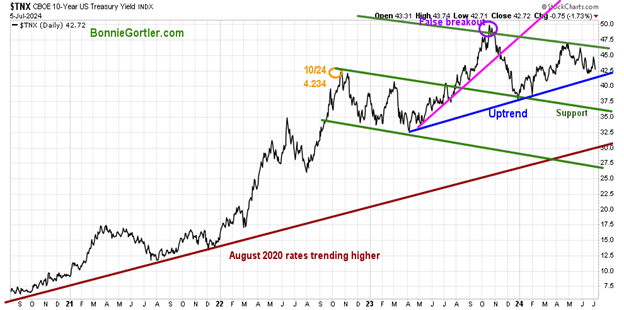
Source: Stockcharts.com
The ten-year US Treasury fell last week, closing at 4.272%, not yet breaking the key uptrend from March 2023. Yields continuing to trend down would likely be positive for US Equities. On the other hand, yields reversing higher and closing above 4.75% could fuel selling pressure in US Equities.
The major market averages were all higher last week. The Dow was up +0.66%, the S&P 500 gained +1.95%, and the Nasdaq was up +3.50%, the best performer. The Russell 2000 Index continues to lag, falling -1.01%. The Valueline Arithmetic Average, which includes approximately 1700 stocks, was down by -0.58%, closing at 10099.33, yet to take out the March high of 10577.97.
Market Breadth is Uninspiring
Weekly market breadth was mixed on the New York Stock Exchange Index (NYSE) and the Nasdaq. The NYSE had 1449 advances and 1429 declines, with 218 new highs and 124 new lows. There were 2055 advances and 2722 declines on the Nasdaq, with 252 new highs and 372 new lows.
Figure 4: New York Stock Exchange (NYSE) New Lows 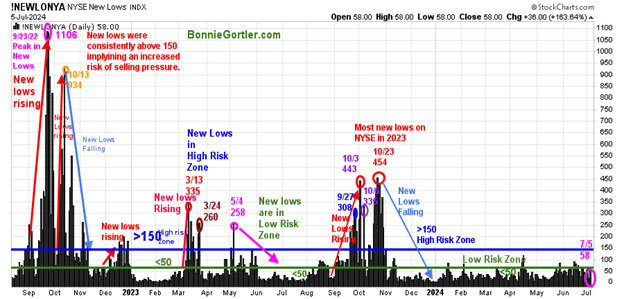
Source: Stockcharts.com
Watching New Lows on the New York Stock Exchange is a simple technical tool that helps increase awareness of the direction of an immediate trend. For most of 2022, new lows warned of a potential sharp pullback, high volatility, and "panic selling," closing above 150. The peak reading of New Lows in 2022 was on 9/23 at 1106, not exceeded in 2023. In 2024, New Lows have stayed below 150, and a good part of the year below 50, a sign of a healthy market.
New Lows on the NYSE remain in the lower risk zone, closing at 58 (pink circle)on 7/5/24. Continue to watch New Lows closely. If new lows fall between 25 and 50, it will be positive in the short term. On the other hand, an increase above 150 would be a warning sign of a market correction. Learn more about the significance of New Lows in my book, Journey to Wealth, published on Amazon.
Fewer Stocks are Making New Highs on the NYSE
Figure 5: New York Stock Exchange (NYSE) (Top) NYSE New Highs (Bottom)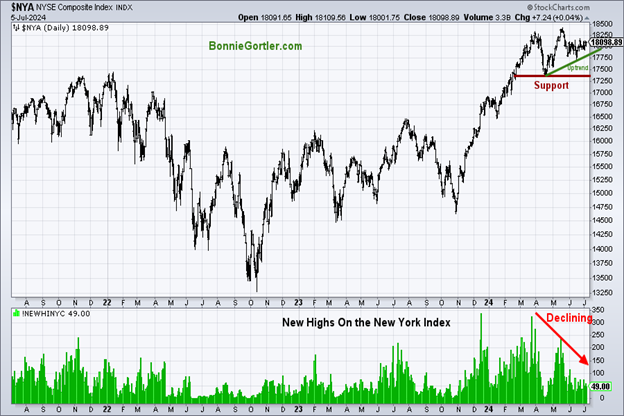
Source: Stockcharts.com
The New York Index has not joined the S&P 500, making a record high on 7/5/24. Fewer stocks are making New Highs on the New York Stock Exchange. For the rally to be sustainable in the short term, you want to see more stocks on the New York Index making New Highs, the uptrend remaining in effect, and continuing to trade above support.
Small Caps Not Participating in the Rally
Figure 6: Daily iShares Russell 2000 (IWM) Price (Top) and 12-26-9 MACD (Middle) and Money Flow (Bottom) 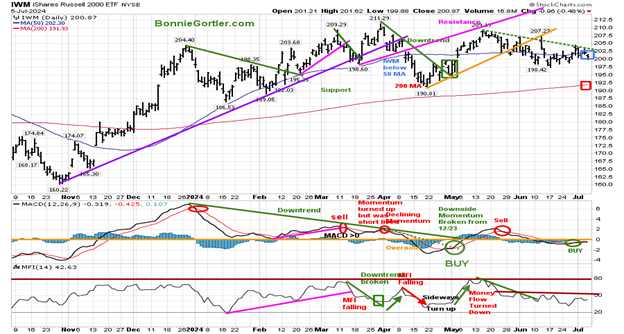
Source: Stockcharts.com
The top Chart is the daily iShares Russell 2000 Index ETF (IWM), the benchmark for small-cap stocks, with a 50-Day Moving Average (MA) (blue rectangle) and 200-Day Moving Average (MA) (red rectangle) that traders watch and use to define trends. IWM peaked in March and fell below the 50-day MA in early April before reversing higher in May. However, IWM could not make a new high and turned down, and it remains in a downtrend (green dotted line).
IWM is trading in a small range, closing lower for the week at 200.87, falling -1.00%, and closing below the 50-day MA. IWM remains weaker than the S&P 500, failing to generate any upside momentum despite the recent MACD buy. After breaking midweek, it closed below a sign of underlying weakness. Support is at 197.00,194.00 and 192.50. Resistance is at 204.00, 207.50, and 211.50. MACD (middle chart) remains on a buy, with little upside momentum, trading below 0.
Money flow (lower chart) rose slightly but remains below resistance at 50. The odds of IWM testing the high will increase if IWM closes for two days above the downtrend (green dotted line) and closes above 204.00. On the other hand, two closes below 197.00 would likely imply more weakness in the future.
Figure 7: Weekly iShares Russell 2000 (IWM) Price (Top) and 12-26-9 MACD (Bottom)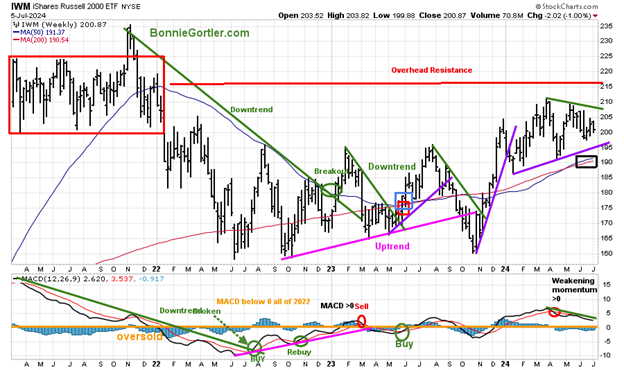
Investors have not had much interest in the Russell 2000 (IWM). IWM remains in a trading range within an intermediate uptrend in 2024 (purple line). IWM continues to close above the 50-week and 200-week Moving Average but below the price peak made in March. A weekly close above 210.00 will break the March weekly downtrend (green line), likely tripping buy stops. Support is at 195.00, 190.00 and 185.00. Resistance is at 205.00, 210.00 and 215.00
In Sum:
There is no excitement yet in the IWM. Traders and institutions prefer Technology at this time. However, when there is a rotation out of Technology, there is plenty of value and room to the upside when IWM gains momentum and breaks through overhead resistance.
Semiconductors and Technology Continue Higher
Figure 8: Daily Semiconductors (SMH) (Top) and 12-26-9 MACD (Middle) and Money Flow (Bottom) 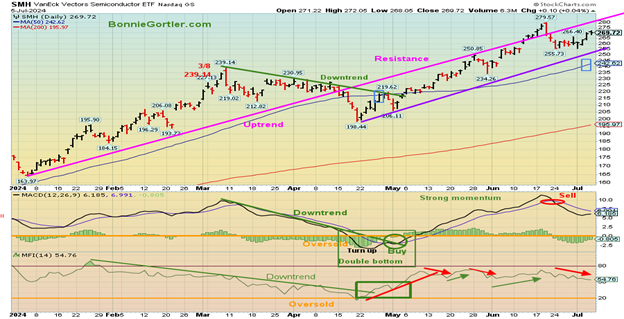
Source: Stockcharts.com
The top chart shows the Daily Semiconductors (SMH) ETF, concentrated mainly in US-based Mega-Cap Semiconductor companies. SMH tends to be a leading indicator for the market when investors are willing to take on increased risk, and the opposite is true when the market is falling.
The Semiconductor ETF (SMH) closed at 2679.72, gaining +3.46%. SMH remains well above the 50-day (blue rectangle) Moving Average, a sign of underlying strength.
Support is 255.00, 242.00, and 235.00. The upside objective of 320.00 remains (see the weekly chart below).
MACD (middle chart) is on a sell, rising above zero. MACD made a momentum high in June, implying another rally was likely in SMH after the peak, which is now in process. A turn down now and falling below support at 235.00 would be negative and negate the upside target of 320.00.
In the lower chart, the Money Flow Index (MFI) has been whipsawing since May under the overbought level of 80 (red and green arrows). In early June, Money Flow turned higher but is now trending downward.
Further strength in SMH is positive for the broad market
Figure 9: Weekly Semiconductors (SMH) (Top) and 12-26-9 MACD (Bottom)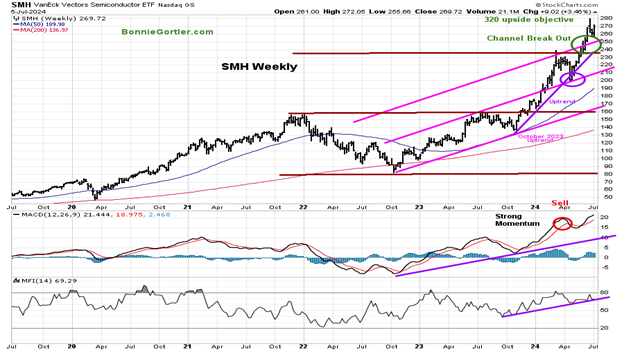
Source: Stockcharts.com
The Semiconductors (SMH) broke out above the intermediate channel in April (green circle), giving an upside objective of 320.00. A weekly close below 232.00 would negate the upside objective and break the weekly uptrend.
MACD, a measure of momentum, is on a sell but continues to rise as SMH broke out above the top channel and has made a higher high in momentum. This implies that the final high in SMH has likely not occurred, although the pace of gains can slow.
If you would like to discuss charts further, email me a good time for you at Bonnie@BonnieGortler.com.
Semiconductor Relative Strength Ratio vs. QQQ Peak?
Figure 10: VanEck Vectors Semiconductor/Invesco QQQ Trust (SMH/QQQ) Weekly Relative Strength Index Ratio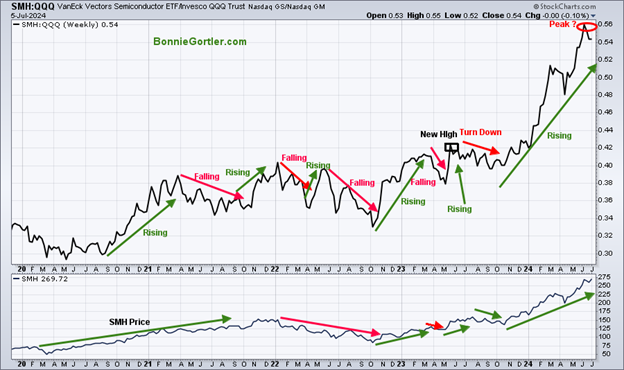
Source: Stockcharts.com
The top part of the chart is the weekly VanEck Vectors Semiconductor/Invesco QQQ Trust (SMH/QQQ) Index Ratio. A rising line means the SMH is stronger, and if falling, the QQQ is stronger.
The SMH/QQQ ratio peaked in March, followed by a new high in May. However, notice the (SMH/QQQ) Index Ratio turned down in June. If this relationship continues, look for potential weakness in SMH or consolidation after the recent gains, which could spread to the Technology Sector. If you like charts, I invite you to join my FB group Wealth Through Market Charts.
Figure 11: Daily Invesco QQQ Trust (QQQ) Price (Top) and 12-26-9 MACD (Middle) and Money Flow (Bottom)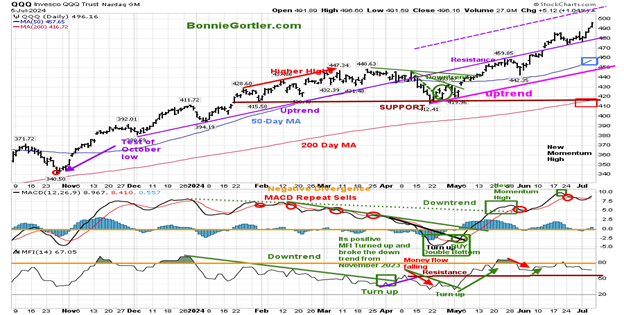
Source: Stockcharts.com
The Chart shows the daily Invesco QQQ, an exchange-traded fund based on the Nasdaq 100 Index. QQQ made a low in October 2023 (red circle), followed by an uptrend at the start of 2024.
Nasdaq 100 (QQQ) rose +3.56% last week and remains well above the 50-day MA (blue rectangle) and the 200-day MA (red rectangle). Support is at 480.00, 460.00, 450.00, and 420.00. The intermediate-term objective remains 520.00 (chart not shown). A weekly close below 460 would negate the upside objective.
The bottom chart, MACD (12, 26, 9), is on a sell above zero and rising. MACD made new momentum highs (green rectangles) in May and June, confirming the new high in QQQ. Notice how, in July, MACD did not make a new high. A turn down without making a new high in momentum now would be a warning of short-term weakness to follow.
Money flow (lower chart): MFI hit 80 (orange line) in May before pulling back and moving sideways in June and the start of July. As long as it stays above 50, I view MFI as positive.
In Sum:
QQQ continues to show strong leadership, leading the market higher. I would like to see QQQ remain above 480.00 and MACD continue to rise, implying potential further gains towards 520.00, the intermediate upside target.
Figure 12: The S&P 500 Index (SPY) Daily (Top) and 12-26-9 MACD (Middle) and Money Flow (Bottom)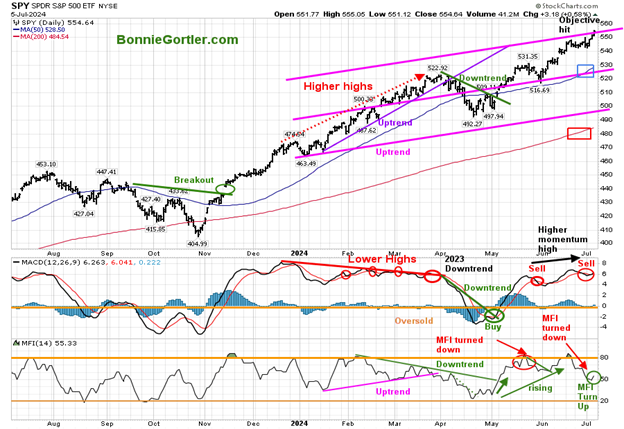
Source: Stockcharts.com
The SPY April downtrend (green line) broke in early May, shifting the short-term trend up. SPY closed at 554.64, up +1.91%, remaining above the rising 50-day Moving Average (blue rectangle) and the 200-day Moving Average (red rectangle). Support is at 544.00, 525.00, 516.00, 499.00 and 486.00. The upside objective of 550.00 was hit. New Objective is 585.00. A close below 525.00 would negate the 585.00 upside objective. MACD (middle chart) is on a sell above 0, not falling enough to get oversold below zero to generate a fresh buy. Money flow (bottom chart) rose above 80 (orange circle) in May and June. Its positive Money Flow turned up last week as the S&P 500 rose to a new record high. The trend remains up with a new upside objective of 585.00.
Summing Up:
Nasdaq and S&P 500 hit record highs last week. Technology and Semiconductor stocks continue to lead the rally despite unimpressive market breadth and fewer stocks on the New York Stock Exchange making new highs. The lack of participation in the Russell 2000 Index is disturbing and worth watching if it continues. Until proven otherwise, the trend is your friend, and it remains up. Be alert to earnings season beginning this week, which could increase volatility. It’s prudent to review your portfolio to ensure you have an exit plan if support levels break and the selling starts to intensify as investors decide it is time to lock in their 2024 profits.
Remember to manage your risk, and your wealth will grow.
Let’s talk about investing together. You are invited to schedule your Free 30-minute consultation by emailing me at Bonnie@BonnieGortler.com. I would love to schedule a call and connect with you.
Disclaimer: Although the information is made with a sincere effort for accuracy, it is not guaranteed that the information provided is a statement of fact. Nor can we guarantee the results of following any of the recommendations made herein. Readers are encouraged to meet with their advisors to consider the suitability of investments for their particular situations and to determine their own risk levels. Past performance does not guarantee any future results


