Markets keep jumping. But the rising tide isn’t lifting all boats equally, states Alec Young of MAPSignals.
It’s no secret stocks don’t move in lockstep. But the spread between the market’s winners and losers has never been wider. Big performance gaps mean winners are paying off more than they normally do. Said another way, now’s the best time in history to be a stock picker. To prove it, we’ll look at the recent breakdown in equity correlation, then note the wide disparity between the top and bottom stocks in each sector, and finally, we’ll highlight where you’ll find the biggest winners in this target-rich environment.
It’s a great moment in history to laser focus on single stocks. Let’s dive into why.
Why Now’s the Best Time in History to Be a Stock Picker
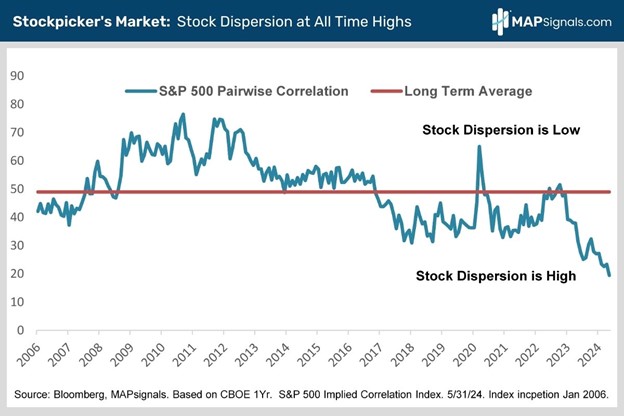
The term correlation in finance is all related to how one stock behaves relative to another. When they all move in tandem, the correlation is said to be high. When stock zigs and the other zags, the correlation breaks down. Pairwise correlation analyzes this behavior, measuring performance dispersion in the stock market. When pairwise correlation is high, most stocks are moving in a similar direction at any given time.
This tends to happen when big macro events like the Covid pandemic, the surprise 2016 Trump Presidential victory, or the Great Financial Crisis are driving trading activity. Conversely, when pairwise correlation is low, there’s a big divergence in how different stocks perform. We tend to see this when the macro environment is calmer and impacting sectors differently, leaving more room for company-specific trends to dominate. That’s exactly what’s happening right now. Pairwise correlation is at an all-time low of only 19%. That compares to a long-term average of 49% (chart). Check it out:

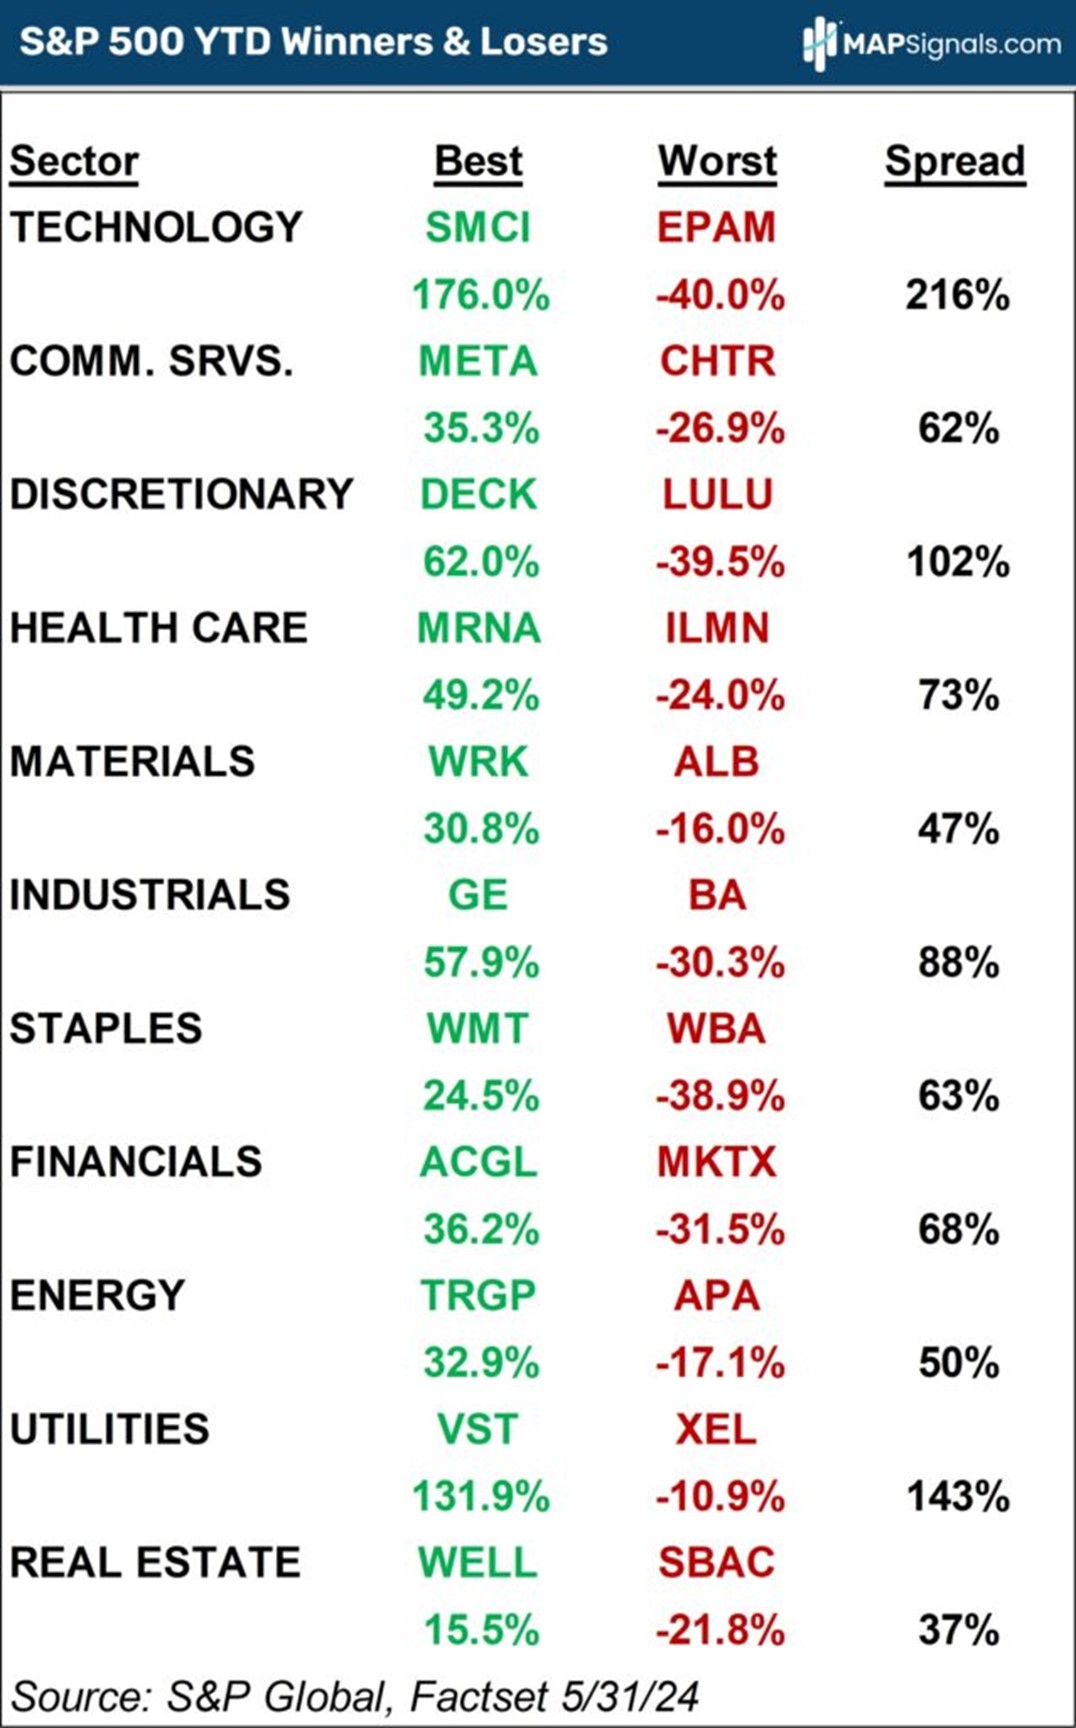
I’m sure most of you have noticed how some stocks are thriving while others are downright dreadful. We see it all over our research. But let’s see it in real-time. Digging deeper into sectors reveals the huge gap between winners and losers. Let’s start with tech. Super Micro Computer (SMCI) a mainstay for MAPsignals since the Summer of 2022, is up an amazing 176% YTD, while EPAM Systems (EPAM) has tumbled 40%. That’s a whopping 216% spread between worst and first. We’re seeing similarly wide performance divergence in every sector. Check out the following table showcasing the top and bottom performing S&P 500 stock by industry:

This level of quiet volatility under the surface means there’s never been a better time to be a stock picker than right now. Bet on the right companies and you’ll do your portfolio a long-term favor. Here’s how to go about catching those outliers.
What This Means for Your Portfolio
Huge performance gaps mean winners are paying off more than usual. This is a great time to hunt for tomorrow’s biggest winning outliers. Turns out, size matters. High-performance dispersion isn’t just an S&P 500 story, it’s playing out in small caps too. Better yet, small-cap leadership looks different than in the S&P 500.
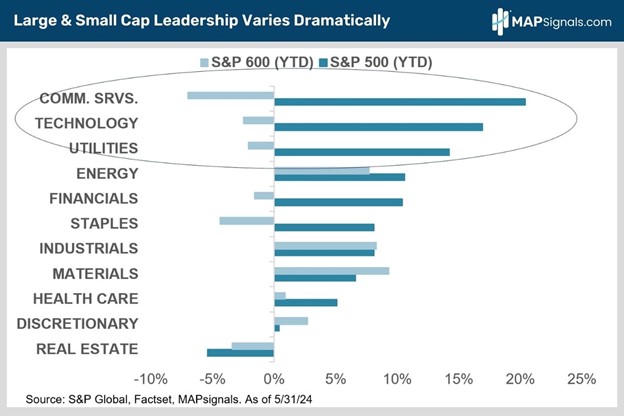
Just because a sector is leading the S&P 500 doesn’t mean it’s crushing it in the small-cap space. This is the most eye-popping chart of the week for us. Note the YTD top/bottom sector performances in both the S&P 500 and the S&P Small Cap 600. Communications Services is up huge for large-caps, while down big in small-caps. Betting on big-cap tech has been a winning trade. Contrast that to small-cap tech which is negative in 2024:

Tech and utilities are handily leading the S&P 500, but in the S&P Small Cap 600, they’re badly lagging behind more cyclical sectors including energy, industrials, and materials. Varied sector leadership across market caps means you need to cast a wide net to find as many of tomorrow’s big winners as possible. That’s great news for MAPsignals’ subscribers because we scour the ENTIRE stock market for big outlier winners. We don’t stop at just the S&P 500.
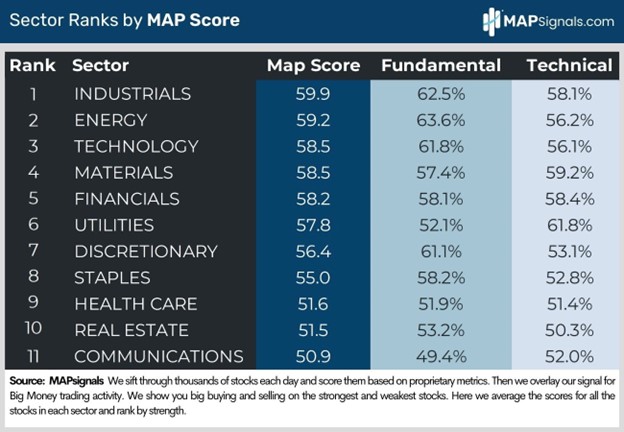
OK, so we know it’s a great time to hunt for future outliers across market caps. Let’s check in on MAPsignals’ sector rankings to find the most target-rich areas. MAPsignals’ sector rankings are equally weighted meaning they span large-, mid-, and small-cap stocks.
We’ve been riding the cyclical train for months. We’re sticking with the call. Industrials and energy are seeing the most institutional buying. Tech is number three, no surprise there. And two more cyclical, materials, and financials, round out our top five sectors:

Focus on where the money is flowing. Then, laser in on the companies with earnings tailwinds, and you’ll find tomorrow’s leaders. It’s that simple. Now’s the best time in history to be a stock picker.
Here’s the Bottom Line
The spread between the market’s winners and losers has never been wider. That’s creating big opportunities for top stock pickers – winners are paying off much more than usual. S&P 500 pairwise correlation is at an all-time low of only 19%. The long-term average is 49%. And outsized performance dispersion is playing out in small caps too. Amazingly, small-cap leadership looks different than the S&P 500.
Tech’s leading large caps but small-cap tech is down YTD, badly lagging cyclical leadership from energy, industrials, and materials. Varied sector leadership across the market cap spectrum means you need to cast a wide net across the ENTIRE stock market to find as many of tomorrow’s big winners as possible. Not only that, single stock picking is where we excel…by simply following money flows into the highest quality stocks.
To learn more about Alec Young, visit Mapsignals.com.


