

US futures rebounded alongside a slightly firmer tone in Europe on Thursday, after Wall Street took a tumble on Wednesday following a hawkish Federal Reserve meeting and poor tech results from Alphabet, Inc. (GOOGL) and Advanced Micro Devices, Inc. (AMD) that took some shine off the A.I. rally, states Fawad Razaqzada of Trading Candles.
The S&P 500 suffered its worst day since September and sharp falls were witnessed for the other major indices such as the Dow and Nasdaq. Several short-term support levels were taken out in the process, with the Dow Jones forming a bearish outside day, albeit at its record high, and the Nasdaq extending its drop from severely overbought levels. The key question for traders is whether the drop this week will mark at least a temporary top in equity indices, or will the dip-buyers step right back in to drive the major indices to fresh record highs. After all, the trend is still technically bullish, following a sharp three-month rally that lifted the major US indices to unchartered territories.
Powell-Triggered Selling Takes Shine off AI-Drive Rally
Following the release of mostly positive data since the FOMC’s last meeting, the Fed was always going to push back against overly optimistic rate cut bets.
Chairman Jerome Powell tried his best to reset expectations for how soon and how fast the FOMC will cut rates this year at the press conference. While Powell acknowledged that the Fed is shifting its focus towards easing policy this year, they won’t be in any sort of rush to do this.
If the rise in stocks was mostly driven by speculation over a sharp drop in interest rates, following the Fed’s hawkish meeting, investors may think about applying the brakes on the rally that has propelled Wall Street stocks to record highs in recent weeks.
There are also some concerns that the A.I. hype was getting a bit too much. Last week it was Intel which provided a gloomy forecast, while this week saw Alphabet, AMD, and Microsoft stock prices all drop following their earnings results and updates.
January Barometer Point to a Positive 2024 for Stocks
Still, the bulls will argue that regardless of the short-term direction of stock prices, 2024 will be another positive year. They will point to the fact that the direction of January often dictates the directional bias for the rest of the year.
As per Bloomberg, citing Stock Trader’s Almanac, the theory of a phenomenon known as the “January Barometer” suggests that if stocks rise in January, they’ll be poised to finish the year higher, too. Data going back to 1938, suggests the January Barometer has been right about 74% of the time.
Nasdaq Technical Analysis and Trade Ideas
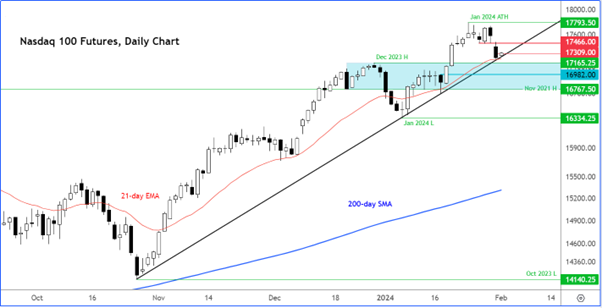
After a two-day drop, the Nasdaq has now arrived, and bounced, from the first key support area around 17220/30. This is where the bullish trend line which has been in place since November, meets with the 21-day exponential moving average. Given the steep bullish trend, it is hardly surprising to see a bounce here, even if it turns out to be a temporary stop.
Below this area, we have a cluster of support marking the previous all-time highs made in December of last year and in November of 2021, at 17165 and 16767 respectively.
In between these two levels is the base of the bullish breakout that started in the middle of January at 16980ish, which is another potential support level where the index may at the very least bounce from.
There are now at least two areas of resistance to watch on the upside, which the bears will need to monitor and defend if they want to exert more pressure.
The first one was being tested at around 17310 at the time of writing, correspondingly to an intraday level which you won’t be able to see on the daily time frame. The bears wouldn’t want to see too deep a retracement. So, for them, it would be an ideal scenario if the selling pressure were to resume around this area or slightly higher.
The second potential resistance level is at the 17465 area, which was supported for a few days before Wednesday’s drop. This level was already tested on Wednesday.
All told, the mid-week sell-off has not yet caused any major technical breakdown in this bullish trend. Key support areas are still below market, where we might see the market stage its next up leg. Until such a time we see a lower low, it is important not to get too excited by this week’s drop if you are a bear. But the drop does serve as a reminder that the markets can go down as well as up. Risk management should therefore never be forgotten regardless of how confident one is in the market’s direction.
To learn more about Fawad Razaqzada visit TradingCandles.com


