The seesaw market continues as investor worries linger, states Lucas Downey of Mapsignals.com.
Our data still points to further equity weakness as stocks remain in a downtrend. But there are bright spots under the surface…more on that in a bit. Earlier this week I learned that Japan found 7,000 new islands. After a recount, geographers learned of these new land masses through digital mapping. The new findings essentially double the island count. Obviously, the islands were always there, they were just hiding in plain sight. Technology revealed them.
This got me thinking about markets. What we see on the surface often isn’t the full picture. While it’s true that money has been flowing out of stocks the past month, some sectors are thriving. There are leading stocks under constant accumulation. I’ll give you one example repeatedly seen in our research. First, let’s take the temperature of the market. The trend points to further weakness.
Stocks Remain in a Downtrend
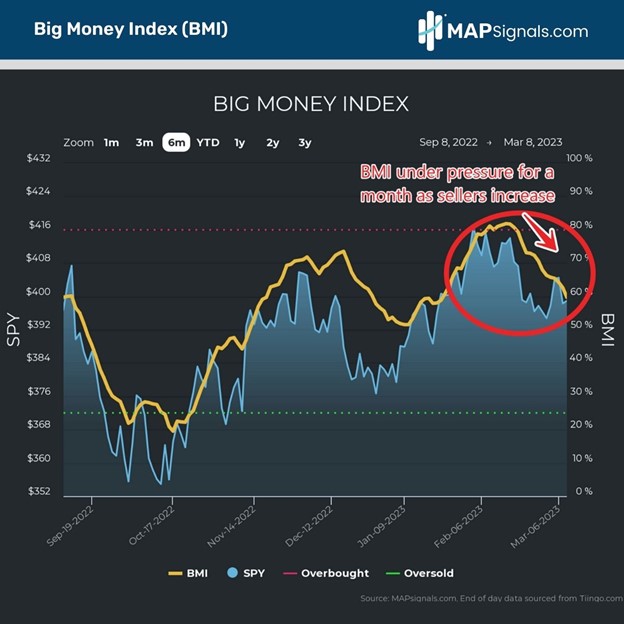
Following inflows and outflows on thousands of stocks, trends reveal themselves. The Big Money Index (BMI) beautifully plots these flows. Beginning in early February, the BMI has been falling hard, indicating sellers are in control. A few weeks ago, I pointed out that stocks are facing overhead supply. That trend hasn’t changed. Below I’ve circled the fall from 80% (overbought) in early February to 59% as of this morning. Our readers know that BMI tends to lead the market. The heaviness in our data is why stocks remain in a downtrend:

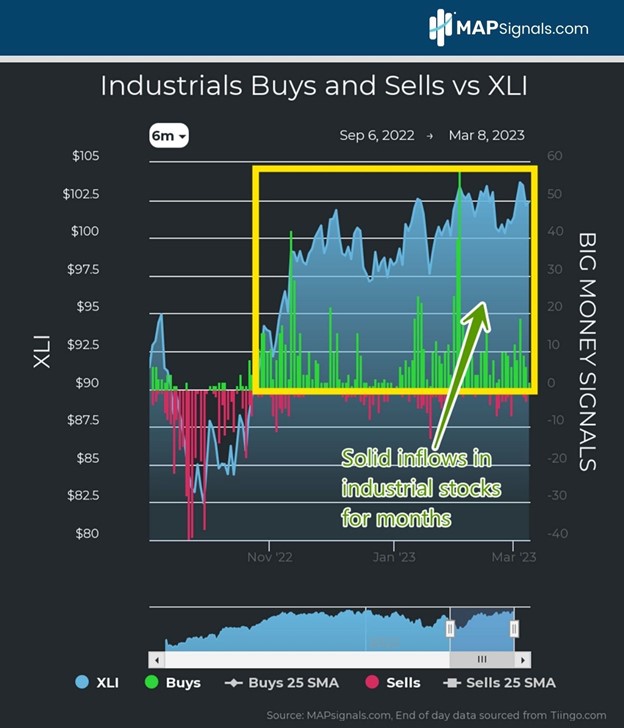
It’s always important to know the overall flow of money. However, it’s equally valuable to keep your ear to the ground on leading groups under the surface. MAPsignals is all about finding the outlier areas of the market. Industrial stocks are one of the bright spots repeatedly seeing inflows. The below sector chart plots the daily count of buys and sells of our industrial universe vs the Industrial Select Sector SPDR Fund (XLI). There’s been very little selling in the group in 2023.

When selling is subdued, demand pushes stocks higher. Keep in mind, those green and red sticks are actual stocks seeing unusual trading activity. In our research, we have a ranking process that isolates the best stocks getting bought each week. We score each stock by fundamental qualities like sales growth, earnings growth, and more. The top of the list tends to find strong names with outsized momentum. It’s our way of digitally mapping the market!
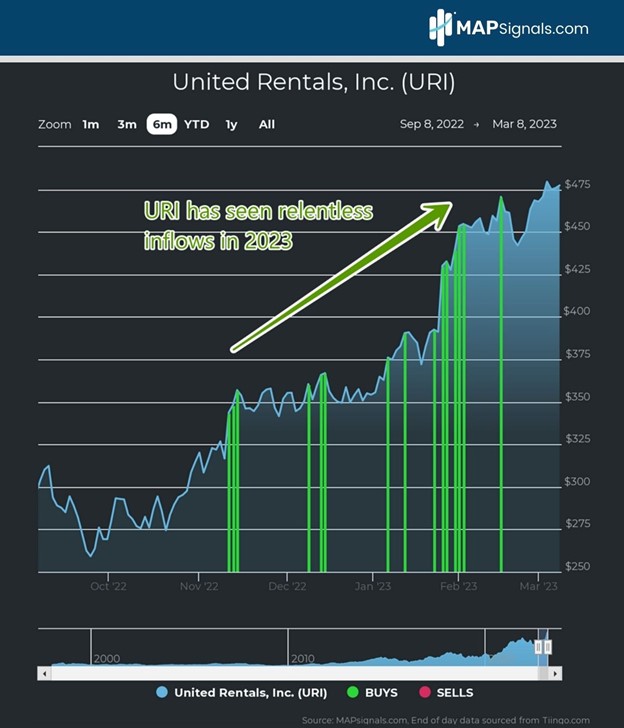
A great example of stock in the industrial space is United Rentals, Inc. (URI). It’s the largest equipment rental company in the world with well over a thousand rental locations in the US In 2023, the stock has seen nine days of unusually large inflows (green bars). Top stocks tend to keep attracting capital, which is the case with URI:

This was our MAP View weekly stock profile on January eighth. Notice how the stock was well into an uptrend in November and December. Recall that December was a very trying time for markets as the S&P 500 fell 5.9%. This further highlights the importance of understanding institutional flows. Stocks remain in a downtrend, but there’s still money being put to work on a single-stock basis.
You may just need a map to find them! Let’s wrap up.
Here’s the bottom line: Markets remain under pressure. Until the BMI stops falling, expect choppy waters. That’s the bad news. The good news is there are always opportunities when it comes to stocks. The industrials sector is one area outperforming, witnessing notable inflows. Using technological tools, Japan uncovered thousands of new islands! They were hiding in plain sight.
To learn more about Lucas Downey, visit Mapsignals.com.


