The latest bearish phase of this market began in mid-August and has now carried S&P 500 (SPX) to new yearly lows, both closing and intraday, says Lawrence McMillan of Option Strategist.
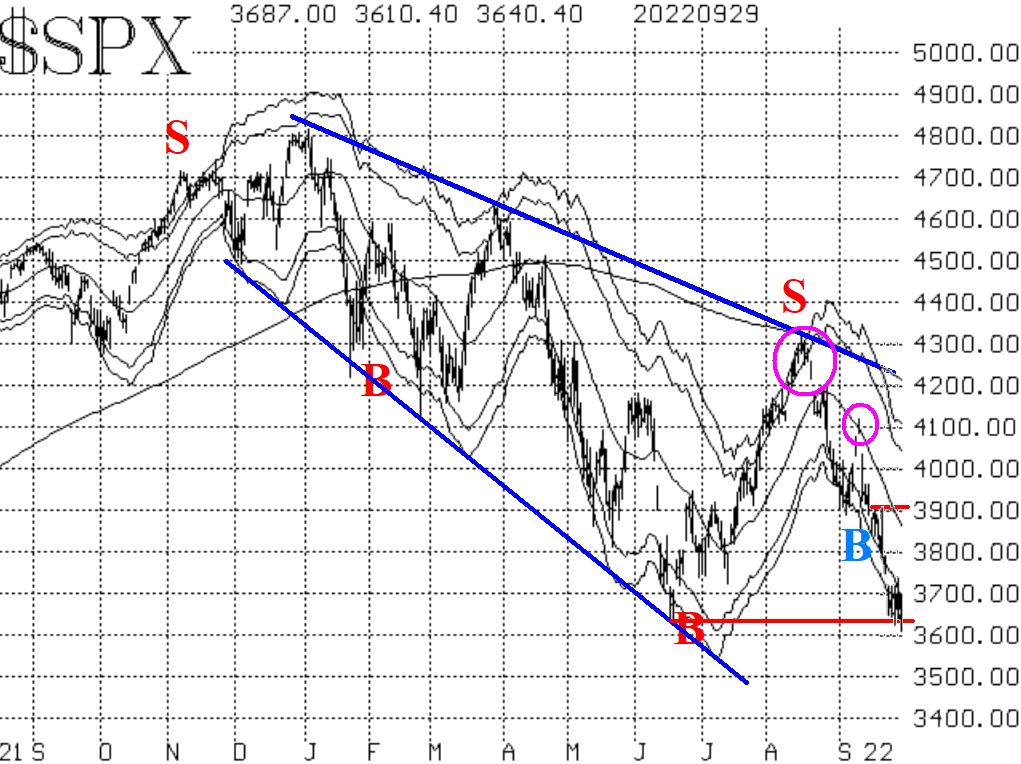
This is a major negative development and reinforces the fact that this is still a bear market. The blue trend lines in Figure One echo that sentiment.

The bulls are desperate to try to hold the market at roughly current levels, and they are quick to point out how oversold the market is, so it surely must be ready to bounce. Yes, the market is oversold, but "oversold does not mean buy."

Since we are at yearly lows, we have to go back to the fall of 2020 to discern where support might exist. It seems that could be found in the 3550 area. As for overhead resistance, there is some at 3720-3750, which is the area of the daily highs for the past week.

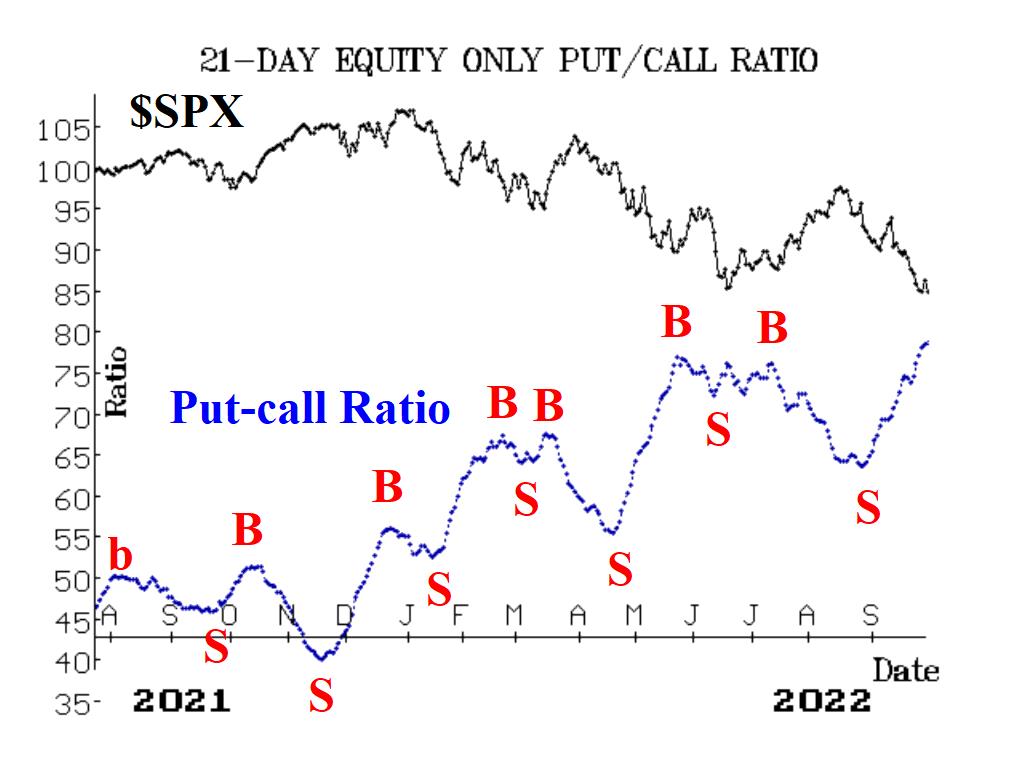
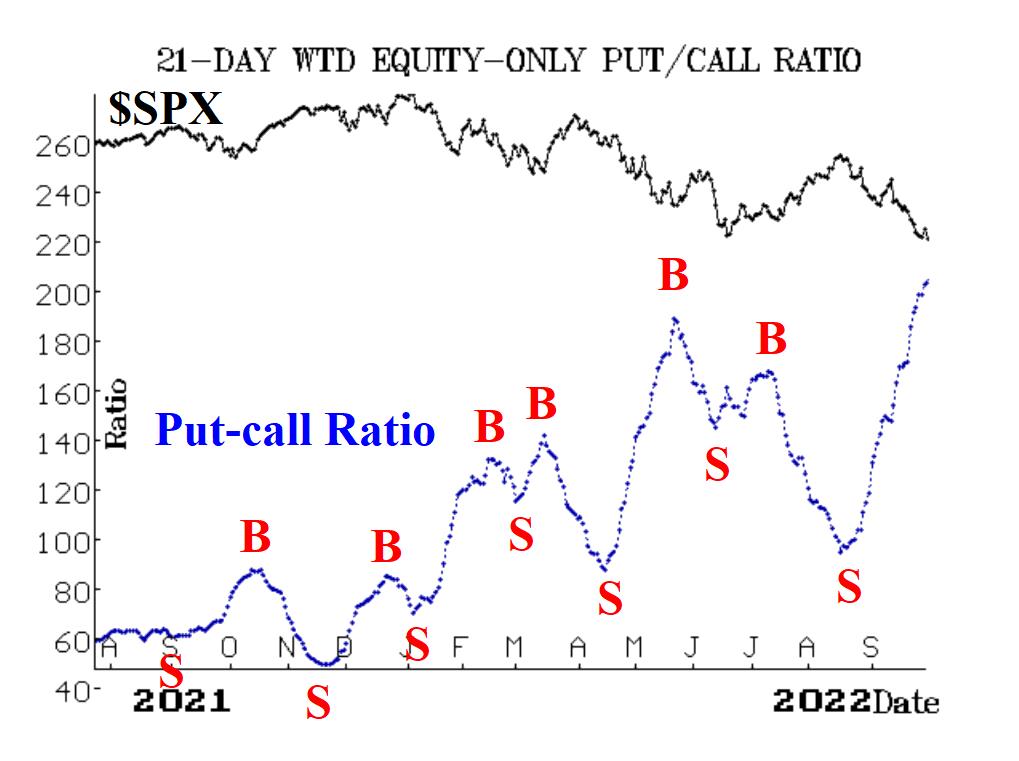
Equity-only put-call ratios remain on sell signals, as they continue to move higher. They are at new highs for the year and are at the highest levels since March 2020. That makes them oversold. But they won't generate buy signals until they roll over and begin to trend downward.
Breadth has been quite poor, and the "stocks only" breadth oscillator made a new all-time low on both September 23 and September 26. The NYSE breadth oscillator is also very low but did not set a new record low. Hence, these breadth oscillators remain on sell signals but are very deeply oversold.
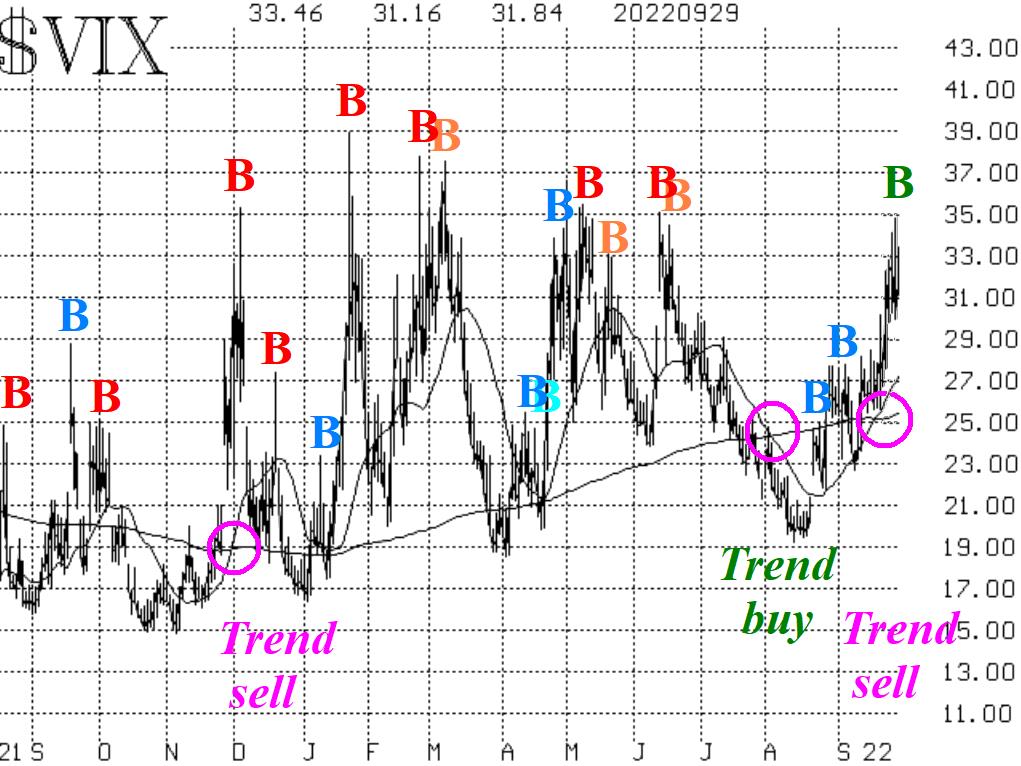
Cboe SPX Volatility Index (VIX) is trending higher, which is bearish for stocks. On a shorter-term basis, VIX generated a new "spike peak" buy signal on September 28, as it closed more than 3.00 points below the high that it had reached earlier that day, at 34.88. This buy signal will remain in effect as long as VIX does not close above that 34.88 high.

In summary, we are continuing to maintain a "core" bearish position, in line with the downtrend on the SPX chart and the uptrend on the VIX chart. We will trade confirmed signals from the other indicators around that "core" bearish position.


