Last week was particularly tough for investors as all 11 sectors experienced losses to some extent, explains Bryan Perry, editor of Cash Machine.
The S&P 500 (SPX) fell 4.6% after the Fed telegraphed that more tightening of short-term rates lies ahead by year's end when it was thought that the Fed would “hike and hold,” allowing the three 75-point rate increases of June, July, and September to work through the system. It is well understood that any rate increase takes about six months before its full effect is felt in the economy, and the market soured on the notion that the Fed might overshoot.
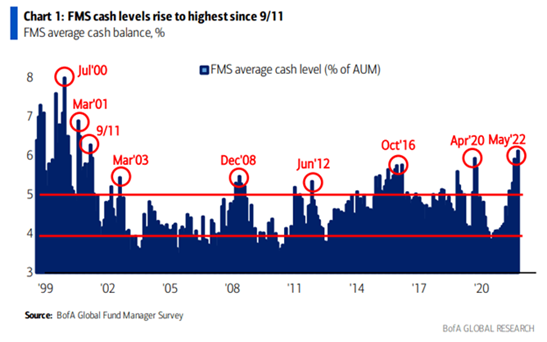
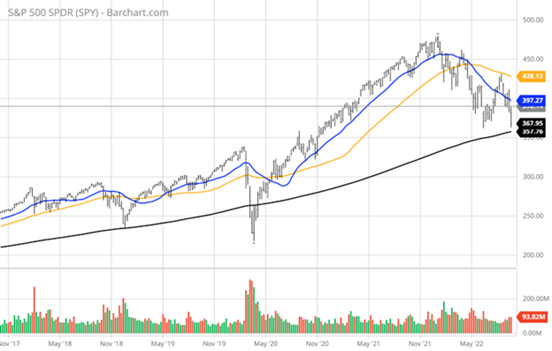
The S&P has now shed 23% year to date and came within ten points of the June 3,647 low as the third quarter comes to a close. This kind of price action puts pressure on fund managers trying to window dress portfolios to show they have the right blend of risk and cash, which just happens to be at an extreme level that has historically defined a market bottom going back to the dot-com crash.

The S&P 500 ended Friday's session at 3,693.23, down from last Friday's closing level of 3,873.33. This follows a 4.8% tumble the previous week ahead of the Federal Open Market Committee (FOMC) meeting last week that pushed the market benchmark's slide during the last two weeks to 9.2%. With just one week remaining in the month, this puts the S&P 500's decline for September to date at 6.6%.
The Dow took out its low for 2022 but doesn’t carry the same technical implications as a priced weighted index. The Nasdaq and Russell 2000 also tested their June lows last Friday.

A view of the five-year chart of the S&P 500 shows the long-term uptrend line coming into play at 3,570 or roughly 3.6% below where the market closed Friday. Looking at the breach of this line in May 2020 was due to panic selling from the Covid-19 outbreak that quickly repaired itself when the emergency stimulus was enacted. The previous test in November 2018 was brought on by the market’s “taper tantrum” when the Fed threatened to hike rates back then.
The current Fed Funds rate stands at 3.00%-3.25% with the Fed laying out a dot-plot plan for a year-end target of 4.4% that would take 30-year mortgage rates above 8.0% by some estimates. It now appears that after the Fed has popped the equity balloon, the US central bank now is targeting the housing market to bring down rent inflation as well as the labor market where wage inflation has been very prominent.
Both forces will be harder to conquer than deflating the stock market. Record housing prices could easily give back 10% on a national basis and as much as 25% in some of the hottest and most overpriced markets such as Boise, Idaho; Austin, Texas; Charlotte, North Carolina; Nashville, Tennessee; Phoenix, Arizona; San Diego, California; and Tampa, Florida.
Bringing wages down will be near impossible without widespread layoffs. With the labor market staying tight with net new jobs created each month, inflation may be long-lasting.
Other central banks outside the United States raised rates in lockstep with the Fed, even after data showed a significant decline in economic activity in Europe that portends a hard landing for the region. Energy prices pulled back further in reaction to the data.
That drop in energy prices is somewhat counterintuitive to the headline that Russia’s President Vladimir Putin is calling up 300,000 reservists to fortify his forces in Ukraine, sending a clear signal he is digging in and not willing to negotiate or submit to calls by global leaders to stop the war he started on Feb. 26.
Inflation is clearly coming down across the commodity markets. Everything from crude, natural gas, gasoline, wheat, corn, soybean, sugar, lumber, cotton, copper, cattle, lean hogs, and copper prices are pulling back with the CRB Index returning to levels not seen since this past March. These broad price declines will certainly show up in the forthcoming inflation data.
This week, investors will receive key data on the housing market, economic growth, and inflation. Tuesday will feature releases of August new home sales, as well as the S&P Case Shiller US home price index for July, followed by the pending home sales index for August on Wednesday.
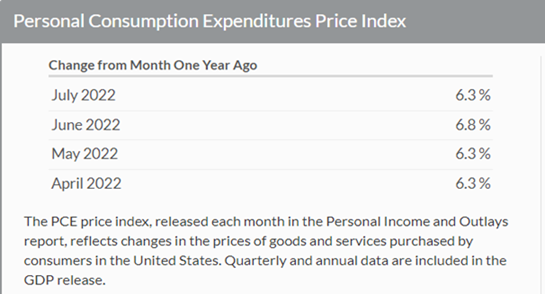
Thursday, Q2 revised gross domestic product will be released, followed by the Friday release of the Personal Consumption Expenditures, or PCE, price index, a closely watched inflation reading, for August. That price index is the Fed’s preferred inflation barometer.
The market is grasping for any hints of inflation ebbing from the June peak, but much of the current downturn in commodities took place in September. In this regard, the large basket of housing data (FHFA Housing Price Index for July, Case-Schiller Home Price Index for July, New Home Sales for August, MBA Mortgage Applications Index for the week ending Sept. 24, and Pending Home Sales for August) will likely matter the most when weighing the huge influence housing has on the gross domestic product (GDP).

Sources: www.bea.gov
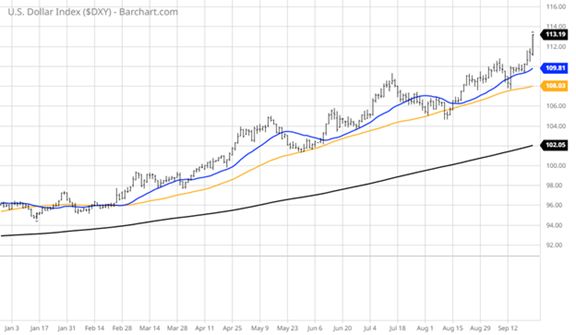
The biggest headwind for the market continues to be the powerful rally in the US dollar against all developed and emerging market currencies. Charts of the pound sterling, euro, yen, looney, krona, and yuan are in protracted downtrends. The combination of the Fed’s monthly quantitative tightening (QT) of $95 billion coming out of the financial system and the flight to safety is fueling a major upside move in the greenback.

One wonders what sort of headline it will take to turn the tide and bring confidence back to the market. It will take probably several headlines about inflation being on the decline, some better-than-expected earnings from companies of market-leading stocks, and a change in the makeup of Congress come election time. With stocks in extremely oversold territory, a 7%-10% rally is probably in the cards near term that gets the S&P back up to 4,000 where the 50-day moving average lies overhead. From there, Mr. Market will have a lot of wood to chop to break the dollar and bring back the bulls.


