This is one of those "what could possibly go wrong" markets, states Joe Duarte, technical specialist and editor of In the Money Options.
For sure, certain parts of the market are doing fairly well, while others are getting hammered. But you get the feeling that something is lurking out there that could just finish the job and send stocks plummeting to new lower lows. Still for now, those who are willing to take a chance are doing well with concentrated bets in agriculture and energy related sectors.
Is There an Oil Top Coming?
I realize that this is a very contrarian question to ask at the moment, given the geopolitical situation. But the price of Crude Oil (CL=F) has gone parabolic—rising straight up.

Parabolic prices are usually the prelude to significant price declines. And the chart of the United States Oil Fund (USO) is a perfect example of such a price pattern and potential reversal.
Consider the following:- RSI is well above 80—an exceptionally overbought level.
- ROC is also parabolic, meaning that momentum is in the moonshot phase.
- And USO is trading four points above the upper Bollinger Band which means that a reversion to the mean, a move back inside the band and perhaps to the 20-day moving average is likely in the next few days to weeks.
Of course, I may be wrong. But it sure feels as if the rally in oil has gone as far as it can in the short term.
Powell Delivers Happy Talk and Markets Like it for a Bit
Right on schedule, Fed Chairman Powell, during his recent congressional testimony soothed the market’s rumpled nerves by stating that he favored a 25 basis point rate increase after the March FOMC meeting, adding that the Ukraine situation added uncertainty to the markets.
And that’s all the algos needed to rally stocks at least for a bit. Until, of course, the Ukraine situation become more uncertain and things got messy.
Last week in this space, I made two major points:
- The New York Stock Exchange Advance Decline line (NYAD) may have delivered a bullish technical divergence.
- The Fed doesn’t want a deep recession—more like a time-out in the economy.
Certainly, despite the late week volatility, both points are still plausible. First, as I describe below, NYAD again did not make a new low. This suggests that there are still enough stocks rising to keep the market’s breadth from a complete collapse.
Of course, that could change at any time.
Moreover, until proven otherwise, Mr. Powell’s testimony confirmed my expectations, which means that the Fed will increase rates in March and likely see what happens next before making any more moves. In addition, barring extraordinary circumstances, I expect the Fed will stick to the slow and steady plan for raising rates until the stock market shows its displeasure by tanking.
And while this is all neat and tidy sounding, if something completely unexpected happens, like maybe a liquidity squeeze which freezes trading, then all bets are off. So, just keep asking yourself: What could possibly go wrong?
Welcome to the Edge of Chaos:
“The edge of chaos is a transition space between order and disorder that is hypothesized to exist within a wide variety of systems. This transition zone is a region of bounded instability that engenders a constant dynamic interplay between order and disorder.” –Complexity Labs
Market Breadth Bends but Does Not Break Altogether
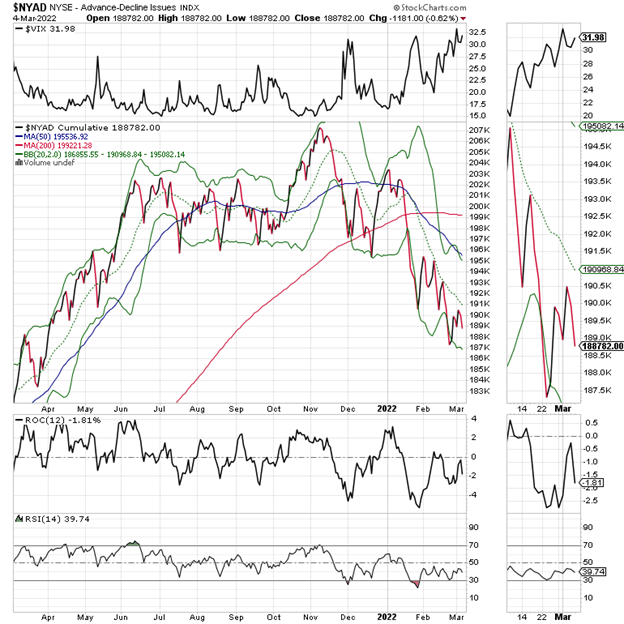
The New York Stock Exchange Advance Decline line (NYAD) remained above its recent lows, as the energy and Ukraine related stocks continue to attract money. There are enough of these stocks rising to keep market breadth from collapsing.
And despite the gloom and doom there is still the possibility of a bullish divergence, as NYAD made a new low but the RSI has not made a lower low compared to its most recent low. This suggests that we may have seen the panic bottom and that prices may stabilize now.
This thesis will fall apart if NYAD makes a new low and RSI falls to a new low as well.
VIX Sneaks Higher
Meanwhile, the CBOE Volatility Index (VIX) continues to creep higher, seeking out a new high midweek, which suggests that fear is once again on the rise.
A rise in VIX signals that put option volume (bets that the market is going to fall) are on the rise. What follows when put volume rises is that rising put volumes cause market makers to sell puts and simultaneously hedge their bets by selling stocks and stock index futures.
Speaking of VIX, in my recent video, I expanded, in detail, as to how this process works.

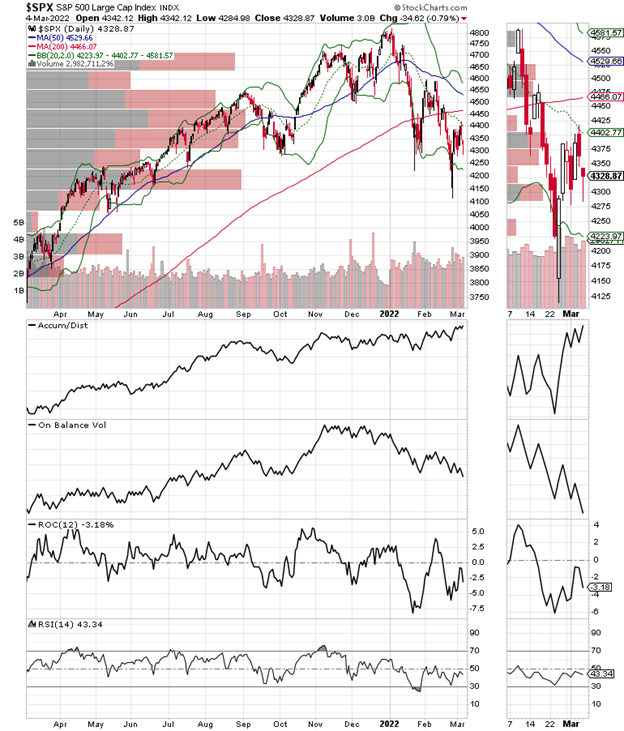
The S&P 500 (SPX) is tracing a similar pattern to NYAD, with Accumulation Distribution (ADI) rising, a sign that short sellers are bailing out. Unfortunately, On Balance Volume (OBV) is falling which suggests that few buyers are following through after bursts of short covering. Moreover, before anything is settled a test of the 200-day line resistance level is in the offing.
4100-4300 remains the key support band.

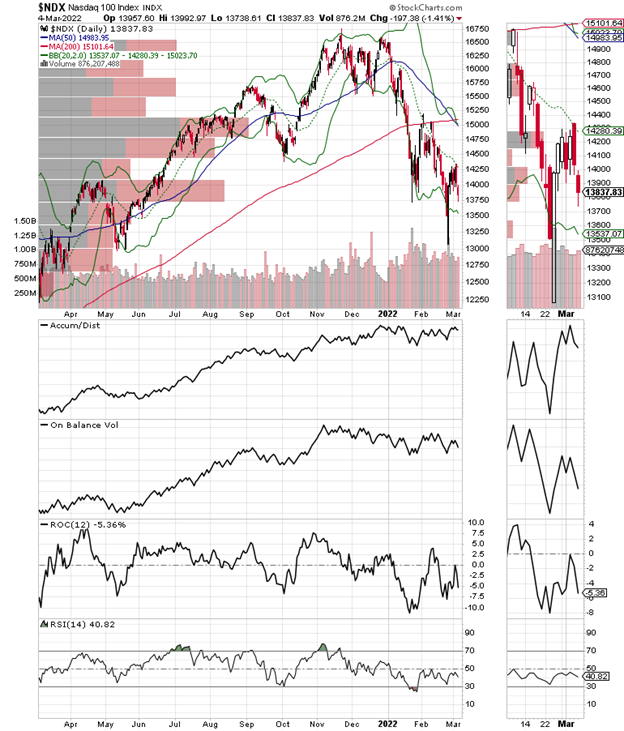
The Nasdaq 100 Index (NDX) also remained below its 200-day moving average with 13,100 remaining as the recent low and ultimate support.

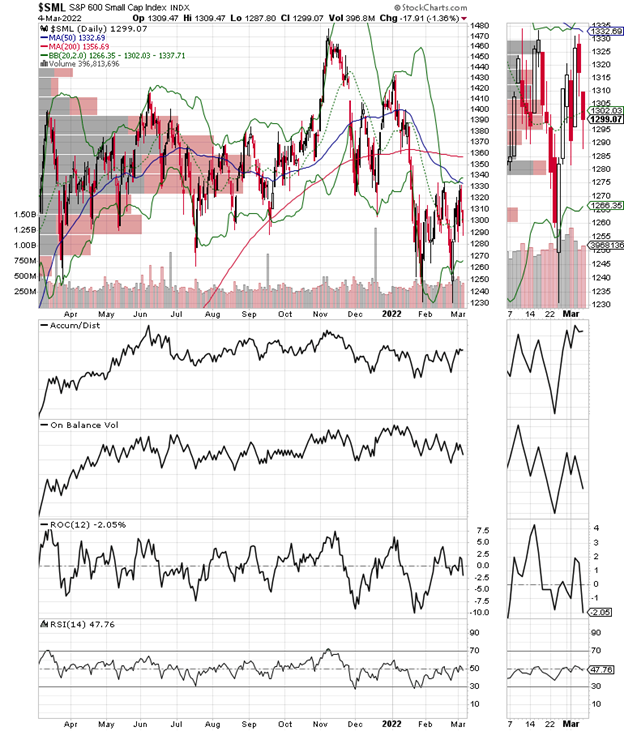
The S&P Small Cap 600 Index (SML) is showing some relative strength as its volatility has been dampened lately. This suggests that small stocks may be an important component of any future rally. Stay tuned.

To learn more about Joe Duarte, please visit JoeDuarteintheMoneyOptions.com.


