The Federal Reserve may find itself in a tight spot given its upcoming interest increases, especially its timing, which may be coinciding with a slowing US economy and rising geopolitical tensions, notes Joe Duarte, technical specialist and editor of In the Money Options.
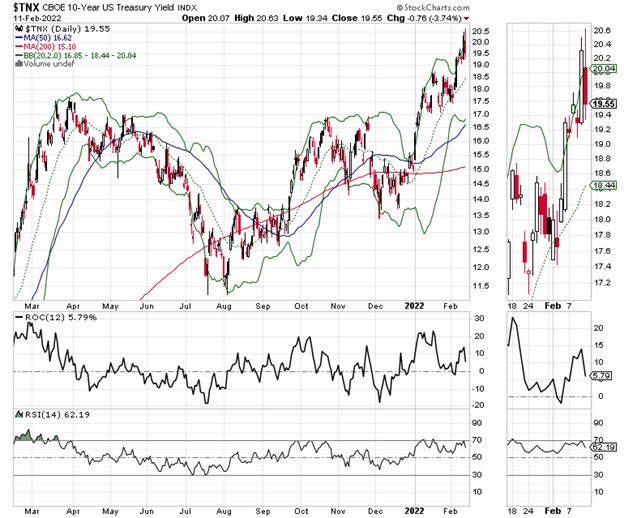
If you haven’t noticed by now, every time the market puts together a credible up move, the Fed comes out and threatens to raise interest rates aggressively. A perfect example is the 2/10/22 comments by St. Louis Fed governor Bullard, where he suggested that the Fed may raise rates as much as by 1% by July first. Of course, stocks tanked as bond yields rose above the 2% level on the US Ten-Year note (TNX).
Meanwhile, the future of the MELA system—where the markets (M), the economy (E), people’s life decisions (L), and the algos in the market (A) work in tandem fueled by the wealth effect created by the stock market—hangs in the balance. Consider the fact that growth in MELA works best when stocks rise. That’s because the rise in trading accounts, 401 (k) plans, and even cryptocurrencies—whose fate is often tied to stocks—make people feel wealthier. In turn, this wealth effect induces people to buy more things and the economy rises. So, yes, the stock market and related investment areas influence the economy, more than the economy influences the markets.
Moreover, the Fed knows all about the MELA effect, which is why they target the sources of income such as the stock market with their comments in the hopes of slowing the economy. So, the real question is why Bullard, and others have been fanning the flames of late. Meanwhile, on 2/11/22, the latest Michigan consumer data delivered the lowest readings since 2011 while tensions are rising in Eastern Europe and Canada.
The Fed’s Gambling
If I’m right, the Fed’s been jawboning the markets down in hopes that when they raise rates, they won’t have to do it as many times as they’re forecasting because the recent pullback in stocks—will have been enough to slow inflation down as a direct effect of a slowing in MELA.
In other words, the Fed knows that stocks rule the roost (MELA, above), and just want to hold the stock market back for a while, not to outright kill it, in the hopes that this will slow inflation. This has worked before for the central bank, and a perfect example of this strategy was displayed in the 2003-2005 period.
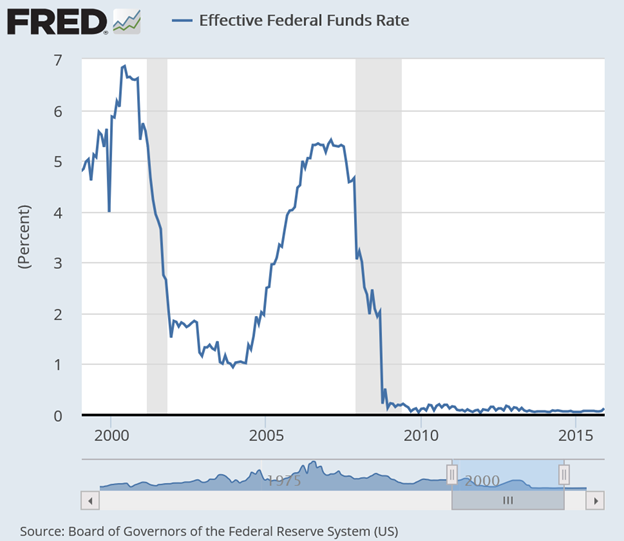
Grey Bars on the Fed Funds Chart Illustrate Recessionary Periods.
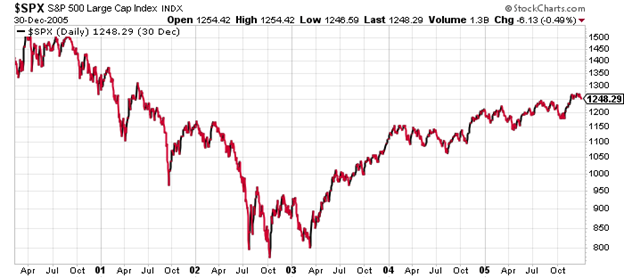
The two charts above illustrate the point as follows:
- The Fed raised interest rates aggressively and popped the Internet bubble and a bear market ensued.
- The Fed lowered interest rates aggressively after the Internet bubble crash bear market, but stocks resisted the Fed’s aggressive rate decreases and continued in a bear market.
- Stocks went nowhere until April 2003 and eventually rallied.
- The Fed raised interest rates again in late 2004 and stocks held their own and rallied.
It’s A Dangerous Game
So, what’s my point?
First, there are recent instances in which the Fed has lowered rates and the market has not responded by rallying. The opposite is also true. Moreover, as we saw in 2003, even very aggressive interest rate declines are not guaranteed to lead to stock market rallies, at least not instantly. Nevertheless, there are no real guarantee as to how the market will react to the Fed’s actions.
In fact, the total wildcard in this analysis is that in 2022, the market is almost fully automated as it applied to institutional trading. On the other hand, there are more active day traders and savvy retail traders now than there were in 2003.
But, as usual, Chaos is rearing its ugly head with the Ukraine situation and the trucker strikes throughout the world. So, while I’m not here to discuss politics, it’s foolish to assume that the algos aren’t reading the headlines and that they haven’t been programmed to respond to news. Thus, what it all boils down to is that the Fed is sticking its hands into a hornet’s nest hoping to pull a magic rabbit out of it. And while that is plausible, given the fact that algos are simple minded trading fools, the Fed may also find a multiheaded snake inside that hornet’s nest.
We’ll now soon enough whether we are in a period similar to 2000-2003 or 2004 and beyond?
Meanwhile:
- Don’t fight the Fed (because the algos believe in the Fed-related headlines).
- Keep an eye on the bond market.
- Don’t fight the market’s momentum (but expect a yo-yo on any given day).
- If a stock does not get stopped out, keep it until the stop gets hit.
- Look for areas of relative strength in the market as this is where the new leaders will come from when all this is over.
- Consider options instead of stocks to reduce risk of loss while participating in any potential upside if the market bounces in the short term.
- Keep a short-term outlook on any new trade—long or short.
- Raise cash either by waiting after being stopped out, by not putting large sums to work at the moment—or both.
- And prepare for more trouble ahead.
Fed Spooks Put Buyers into Action and VIX Explodes
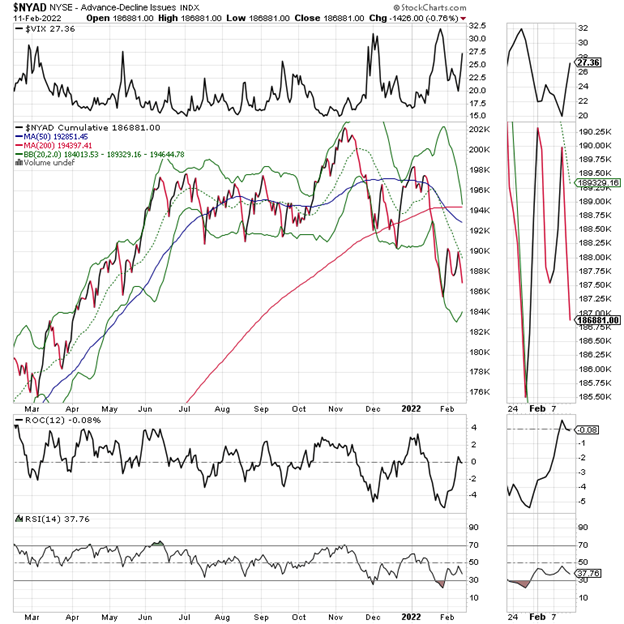
The New York Stock Exchange Advance Decline line had not fully recovered from its recent swoon, and things got a bit worse when the Fed spooked the markets and the put buyers basically freaked out.
As a result, the CBOE Volatility Index (VIX), which measures put volume, exploded to the upside and stocks sank last week. A rise in VIX signals that put option volume (bets that the market is going to fall) are on the rise. What follows when put volume rises is that rising put volumes cause market makers to sell puts and simultaneously hedge their bets by selling stocks and stock index futures.
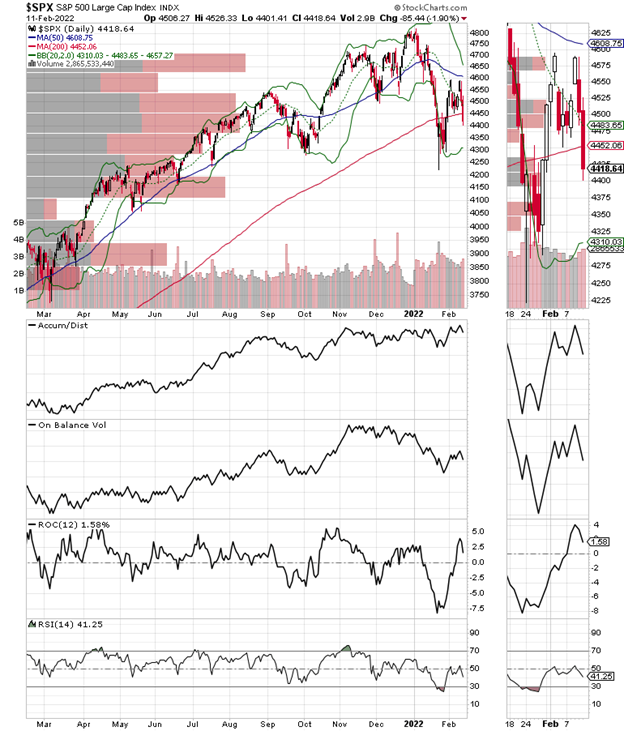
Meanwhile, the S&P 500 (SPX) sold off aggressively, closing below the critical 200-day moving average. On Balance Volume (OBV) and Accumulation Distribution (ADI) softened and the index is still caught between 4300 and 4650. A decisive move before 4300 could lead to lower prices in a hurry.
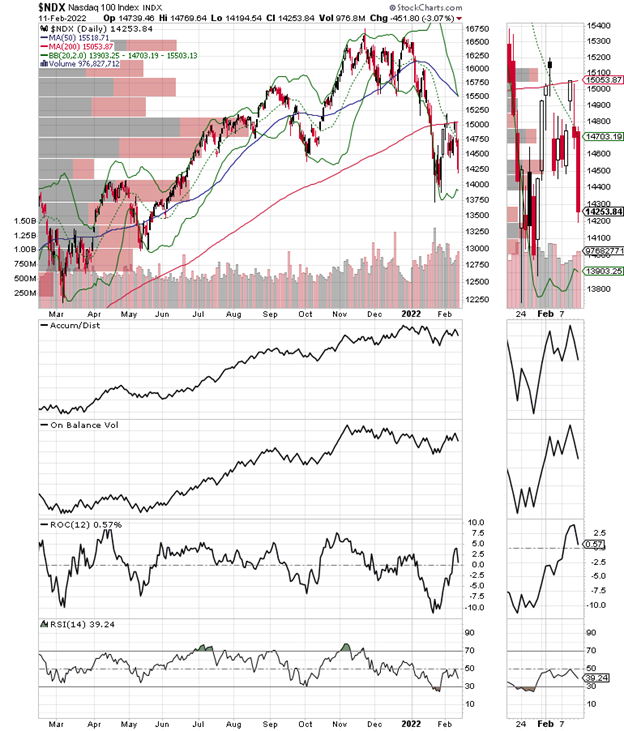
The Nasdaq 100 index (NDX) never made it back above its 200-day moving average.
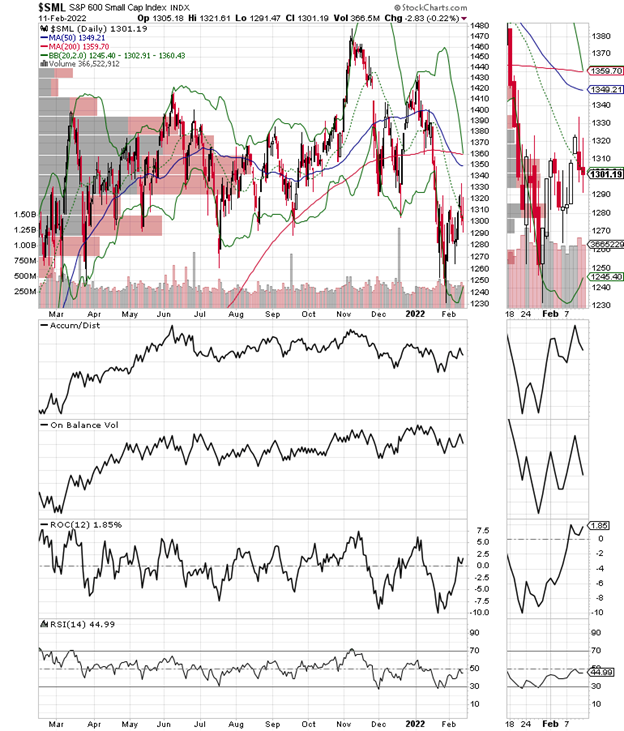
The S&P Small Cap 600 index (SML) again remained well below its 200-day moving average and is showing no signs of any interest in rising or falling in a meaningful way at the moment.
To learn more about Joe Duarte, please visit JoeDuarteintheMoneyOptions.com.


