The purchasing power parity indicator, also known as the PPP is one of the most important long term indicators in Forex trading, states Konstantin Rabin of Finance Makers.
This measure is widely used by financial analysts, commentators, as well as by experienced professional Forex traders.
The fact of the matter is that the ability to measure the relative undervaluation or overvaluation of securities is an important asset in the market. For example, one of the most frequently used measures in the stock market is the price to earnings ratio, also known as the P/E ratio. This indicator is frequently used by investors and commentators to identify the relative valuations of different stocks.
On the other hand, the PPP indicator is the measure which is used for currency valuations. The purchasing power parity indicator essentially represents an exchange rate at which the average prices of goods and services will be equalized between the two given economies. Consequently, if a given currency trades above the PPP level, then it is considered to be overvalued; and it is likely that at some point in the future it might face a correction and subsequent depreciation.
At the same time, many traders are looking for those currencies which trade below the PPP level, since they are deemed to be undervalued and are likely to experience some degree of appreciation in the future.
Here it is worth mentioning that there is no one universally accepted method of measuring PPP indicators. Instead, there are different PPP measurements, which are published by a number of different organizations. One of the most popular PPP measurements is published by the Organization for Economic Cooperation and Development, also known as the OECD. They prepared their reports by comparing the prices of thousands of goods and services between two countries. The report is updated on an annual basis.
Another important PPP measure is published by the British financial journal, The Economist. This report is published with six-month intervals and covers dozens of different currencies, including the ones from the emerging markets as well as all major currencies.
Purchasing Power Parity Indicator in Action
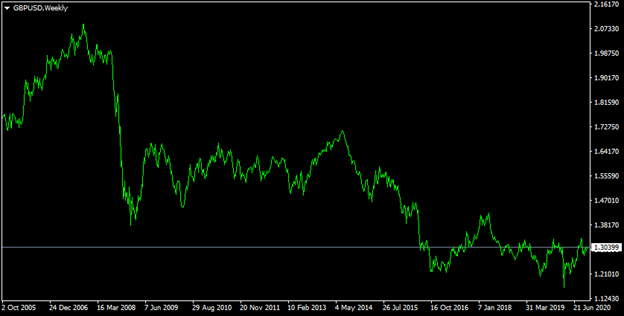
So how does the purchasing power parity indicator work in practice? Well, in order to respond to this question, we can take a look at the number of practical examples. In order to better illustrate one of those examples, we can take a look at this weekly GBP/USD chart:

As we can see from the above diagram, back in the Autumn of 2005, the GBP/USD pair was trading close to the $1.75 level. During the subsequent period, the British currency has made some impressive gains, eventually rising above $2.00 level by 2007.
What happened here was that in June 2008, when the pair was still trading near $2.00 level, The Economist released a fresh report, according to which, the PPP level for the GBP/USD pair was at the $1.56 level. This means that according to the purchasing power parity indicator, by that time the British pound was significantly overvalued against the US dollar.
As we can observe from the above chart, those predictions turned out to be very accurate. From late July of 2008, the GBP/USD currency pair began its sharp decline, dropping all the way down to $1.40 level by the end of the year. During the subsequent years the British pound has experienced a considerable amount of volatility, but it never crossed into the extremely overvalued territory again. By October of 2020, the GBP/USD pair trades close to the $1.30 level.
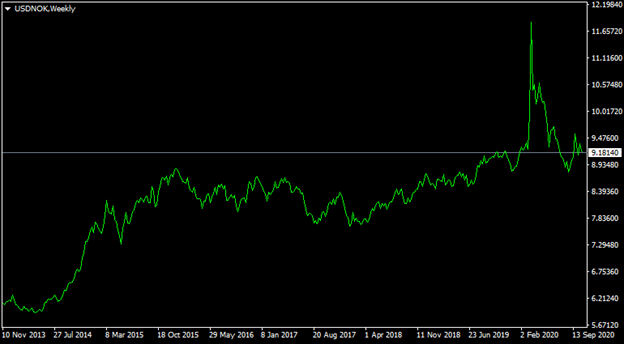
Here it is worth mentioning that the cases of sharp corrections due to PPP overvaluatons is not strictly limited to the GBP/USD pair. We can take a look at yet another example of such scenario, by checking this weekly USD/NOK chart:

As we can observe from the above chart, during the Spring of 2014, the USD/NOK currency pair was trading near the 5.90 level. At that time, according to The Economist’s estimate the PPP value for the USD/NOK pair was at 10.38 level. This suggested that the Norwegian currency was more than 70% overvalued at this point against the US dollar.
Those predictions turned out to be very accurate. As we can see here, during the subsequent years, the US dollar has benefited from a steady appreciation with the USD/NOK currency pair eventually rising all the way up to the 11.80 level in March, 2020. Eventually, there was a correction, which led to some recovery for the Norwegian currency. By October, 2020, the USD/NOK pair trades close to the 9.18 level.
So, as we can see from both of those examples, the undervalued currency eventually managed to make some substantial gains, before it reached the PPP level.
Implications of Inflation Rate Differentials
One of the most interesting aspects of the purchasing power parity indicator is the fact that it also tells us that inflation differentials between the two given currencies can have a sizable impact on the future exchange rates.
This is because the purchasing power parity measure is not a static indicator. Instead, over time it tends to shift in favor of currencies which have lower inflation rates. Consequently, according to the purchasing power parity theory, in the long term currencies with lower inflation rates tend to appreciate against the ones with higher inflation rates.
The reason for this is quite simple. With higher inflation rates, the average price of goods and services become more expensive in a country compared to the other nations. As a result, this leads to a decline in demand and to subsequent depreciation of the currency.
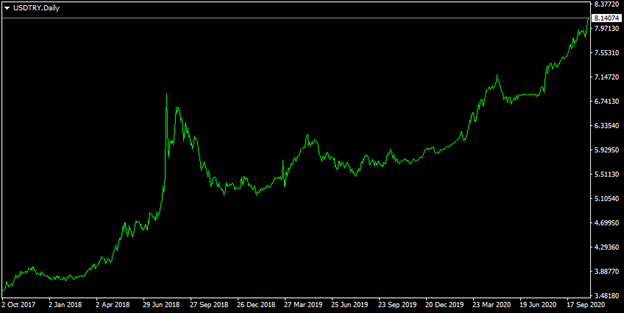
In order to better understand those dynamics, we can take a look at this daily USD/TRY chart:

As we can observe from the above diagram, back in October, 2017, the USD/TRY pair was trading near the 3.55 level. During the subsequent period, the US dollar has made some massive gains against the Turkish currency, eventually rising all the way up to the 8.15 level by October of 2020.
So, as we can see from this example, during the last three years, the USD/TRY exchange rate has risen by more than 129%, which is quite rare, even in the case of the exotic currency pairs. Obviously, this is not because of just one individual reason. Instead, there are several factors involved which led to the depreciation of the Turkish currency.
However, one of the most likely factors behind those dynamics is the fact that there are significant inflation rate differentials between the US dollar and the Turkish lira. The fact of the matter is that the long term average inflation rate in the United States is near 3%. At the same time, the average inflation rate in Turkey for the last couple of decades is above 10%. So, this suggests that one average, the inflation rate in Turkey is at least 7% higher than in the United States.
This leads to the constant shift of the purchasing power parity indicator for the USD/TRY currency pair in favor of the US dollar. So, this is indeed one of the driving forces of the long term appreciation of the US currency against the Turkish lira.
In fact, this dynamic is not strictly limited to the USD/TRY currency pair. There are many traders and investors who are puzzled by the fact that, in the long term, the major currencies generally tend to appreciate against the majority emerging market currencies.
Well, one of the most logical explanations here is the fact that emerging market economies do have a higher inflation rate compared to the developed countries. Consequently, it is not surprising that this shift purchasing power parity indicator in favor of the major currencies, resulting in the long term depreciation of emerging market currencies.
Obviously, this does not imply that all emerging market currencies have to be in a long-term downward trend against major currencies. The reality of the matter is that several central banks managing the emerging market currencies have managed to keep the inflation rate under control and avoid this type of currency depreciation. In addition to that, it is also worth remembering that some countries have fixed the value of their currency to the US dollar or the Euro, consequently they can manage to maintain a stable exchange rate against the major currencies.
Usefulness of the Purchasing Power Parity Indicator
When discussing the characteristics of the purchasing power parity indicator, it is important to point out the fact that the usefulness of this measure depends on the trading style of an individual.
The reality of the matter is that the PPP indicator has very little use for scalpers and day traders. This is because those types of Forex strategies involve short-term trading. The reality of this situation is that the PPP indicator has very little influence on the day-to-day market movements. Consequently, if traders prefer scalping or day trading, then they might turn to other indicators for better guidance.
On the other hand, the purchasing power parity indicator can be very handy for long term traders. This is because it might take months or even more than a year for the market to address the imbalance and return the exchange rate of a given currency pair close to the PPP level. So, as we can see here traders need patience above all in order to succeed with purchasing power parity indicators.
However, for the sake of fairness it is also important to point out that the purchasing power parity indicator is easy to understand and interpret. This measure clearly shows which currency is undervalued and by how far it has diverged from the PPP indicator.
Here it is worth remembering that some Forex trading indicators do require strong analytical skills from traders in order to read them and make accurate predictions in the process. In fact, some indicators like moving average or Bollinger bands can be interpreted in multiple ways, and obviously there is no guarantee that the market participant will always come up with the right conclusions.
On the other hand, the purchasing power parity indicator is very clear about the relative undervaluation and overvaluation of different currencies, and consequently, it is much easier to come up with correct conclusions with these indicators.
This is not to say that the purchasing power parity measure is an infallible indicator. Obviously, there are dozens of other factors that are affecting the currency exchange rates, even in the case of the long-term timeframe. Those factors include the economic indicators, like the real gross domestic product growth rate, the unemployment rate, the consumer price index, and other measurements. In addition to that, the relative real interest rates can also play a decisive role in shaping the long-term trends in the Forex market.
Consequently, it is always helpful for traders to take into account all of the important technical and fundamental indicators into the account before making any trading decisions. In this way, traders can reduce their risk exposure and can even improve the ratio of winning trades as well.
Finally, long-term traders should also take into the account the potential swap charges when holding different positions open for an extended period of time. The market participants have to pay this fee when they buy a lower-yielding currency against a higher-yielding currency, and leave the position open overnight. The size of this fee equals the interest rate differential plus a small commission for the brokerage company.
Now the actual amount of swap payments for a single day can be quite small. However, the problem here is that over long periods of time, this can add up to a considerable amount. Consequently, by ignoring this expense, the market participants might lose a considerable amount of money. Therefore, long-term traders might consider utilizing swap-free accounts in order to avoid those types of potential charges.
Learn more about Konstantin Rabin here.


