Today, I want to talk about a trade that is a little bit different from what we normally discuss, explains Danielle Shay of Simpler Trading.
Normally, I talk to you about my favorite momentum or swing trades. These are usually trades that will last anywhere between three days and three weeks, however, there's something really important that if you haven't already added to your trading toolbox, should be, and that is trading earnings.
A lot of people hear earnings, and they get a little bit nervous because earnings move fast and change overnight, and it often brings a volatile week in the market.
So why would you want to add this trading to your tool kit...?
There's a very clear reason. Earnings season comes around four times per year, so that gives you four distinct seasons where you have lucrative opportunities.
The breakdown to different earnings trades...
There are multiple opportunities within earnings season.
1) Trading the run-up into earnings.
Here, you can start to trade earnings before the reports even come out. I’d consider this type a pretty high-probability trade, and they are also considered swing trades.
2) Trading the actual earnings report.
This one is also going to be a little bit more aggressive because it's an overnight trade and usually it’s all or nothing.
3) Trading the post-earnings move.
Here you trade the report after it’s been published. Typically, these trades are less volatile because you already know the outcome and there isn’t as much speculation.
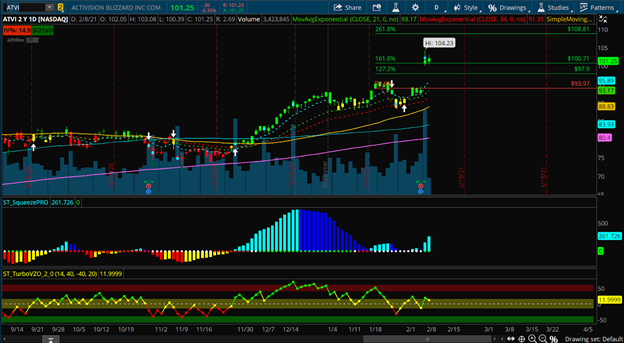
Let me show you how I traded Activision Blizzard (ATVI) during earnings season using option number 1: trading the run-up into earnings...

Here, I decided to take this trade on AVI because I determined it had high-probability, but how did I know that?
One factor I consider when picking an earnings trade is the tickers past earnings reports. For this, I like to use my Run into Earnings analysis tool because it looks back at the past eight quarters, and it's going to tell me how this company has traded after the previous eight quarters’ earnings reports.
What I'm looking for is consistency.
Looking at ATVI specifically...
I could see that it had traded higher over the course of the last two years, so on a fundamental and a technical basis, that’s showing a pattern of higher highs and higher lows. I also saw that over the past few reports it would sometimes trade lower, while other times during earnings it would trade higher. By just looking at this alone, ATVI didn’t pass my consistency test, but I made an exception because other factors gave me the edge to know this was a great trade.
A key factor that my analysis tool did not tell me was that ATVI is a video game company. This is important because we’re in the middle of a pandemic and video-game companies have been Covid darlings. Additionally, I was consulting with a good friend of mine, Landon from LikeFolio, and he was also bullish on the video-game earnings reports. His data is collected by using social media to determine what consumers are using and he had some fantastic numbers that showed video-game usage was up. So I took the factors in front of me and decided to go bullishly right before the report.
How the trade went down…
What I did was I sold a put credit spread directly before the report at the money for 1:1 risk-reward ratio. The benefit of doing this is when you sell a put credit spread right before the report, you're betting on direction.
By selling the put credit spread, I was betting that Activision Blizzard would go higher. What ended up happening was ATVI had such a massive move that it actually traded 2-3x higher than what the market maker expected. This was in essence, a blow-out earnings report. Because I had sold a put credit spread directly before this report when the market opened up the next day, I had a max profit of 100% overnight on ATVI.
Some additional advice:
While this earnings report gave me overnight profitability, I’ll remind you that this was aggressive because it was an overnight trade. I was either going to win or going lose, and there's no ability to take a stop, which is why it's important to risk what you're willing to lose for these trades.
In order to mitigate my risks, I used a smaller size than what I do on a normal trade. For example, I use 1% to 2% allocation. You can also use a half-percent allocation, whereas on a directional trade I would use closer to 3% to 5%.
It’s really important for us traders to understand how to look at earnings season because it comes around four times a year. But it’s even more important to actually understand how to trade it because there are opportunities like this if you know where to find your edge and how to use the data.
To learn more about Danielle Shay, visit SimplerTrading.com.


