Stocks came roaring back this week after a massive oversold condition spurred the rally, says Larry McMillan of Option Strategist.
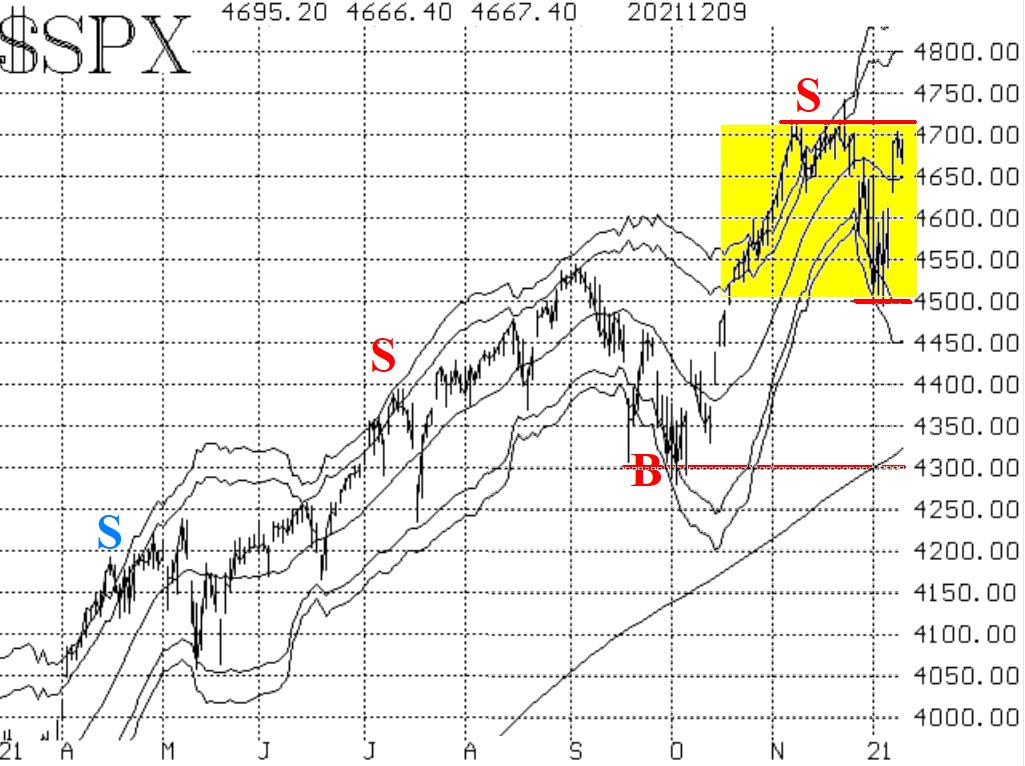
The S&P 500 (SPX) rose all the way to and through its declining 20-day moving average. That brought it back almost to the old highs (4705) where it has met resistance before and did again. Meanwhile, the lows of last week at roughly 4500 are support, and there is also support at 4300 (the early October lows). So, there is a possibility that SPX is still in a trading range (yellow area on the chart in Figure one).


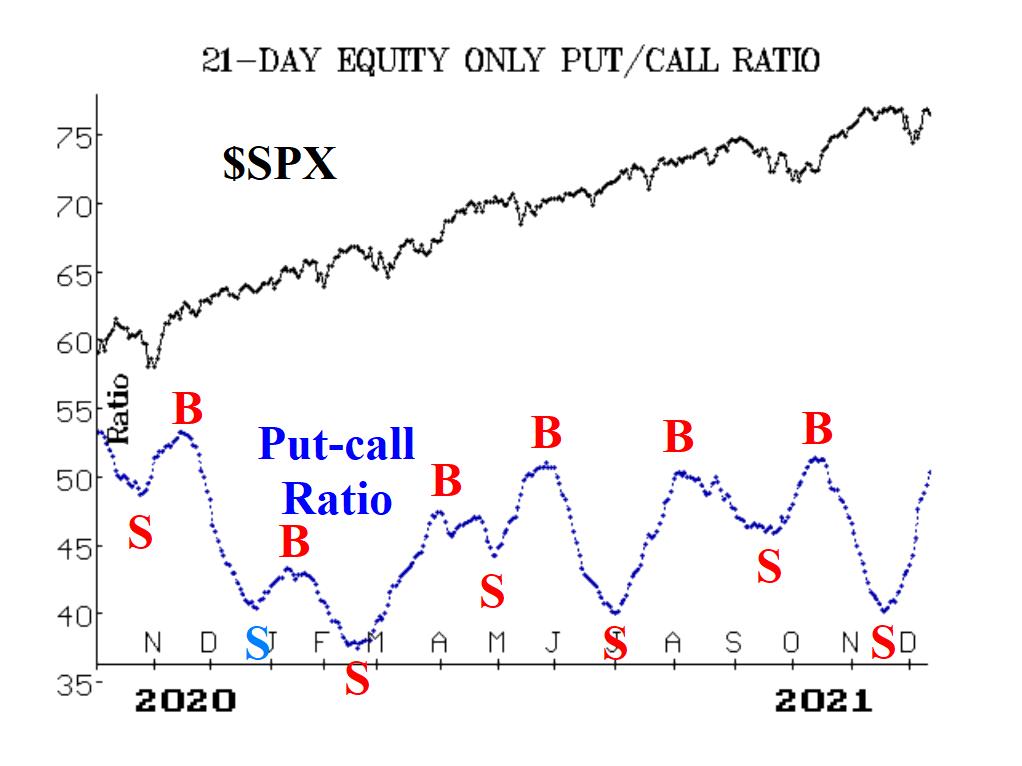
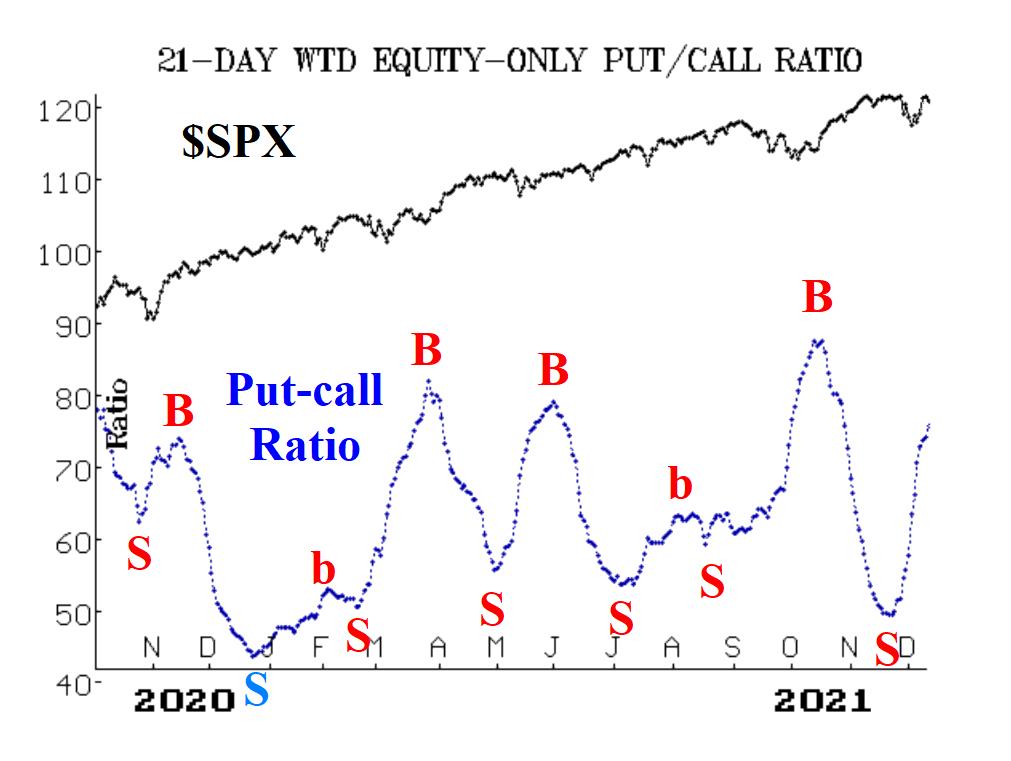
Equity-only put-call ratios continue to rise at a startling pace. Put buying has continued to be strong, even during the rally last week. The ratios will not generate buy signals until they roll over and begin to trend downward. Market breadth has been as volatile as ever. The breadth oscillators generated buy signals as of the close of trading on December seventh. But breadth is already weakening again, so stay tuned.


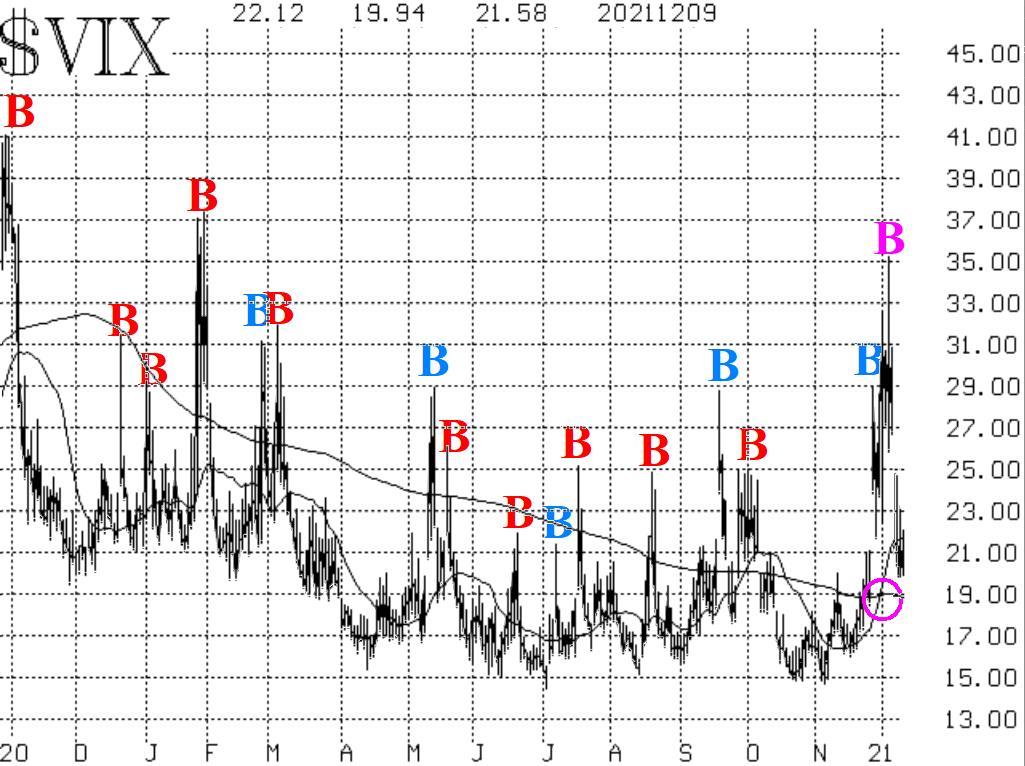
The CBOE SPX Volatility Index (VIX) generated a "spike peak" buy signal on December second, and that is still in place. VIX has been dropping since then, and the market has been rising. If VIX can close below its 200-day moving average, that would be an addition bullish sign. This is supposed to be the time of the year when small-caps outperform, and for a few days, iShares Russell 2000 ETF (IWM) outperformed, but now it's down today as well as the SPX. This is more indication of the same problem that has beset the market for a while now. In summary, we are now seeing buy and sell signals set up. I like the "trading range" scenario until SPX can prove that it is not in a trading range. Regardless, we will trade confirmed signals on both sides of the market.


