The broad stock market has strongly reversed upward at the end of last week, says Larry McMillan of Option Strategist.
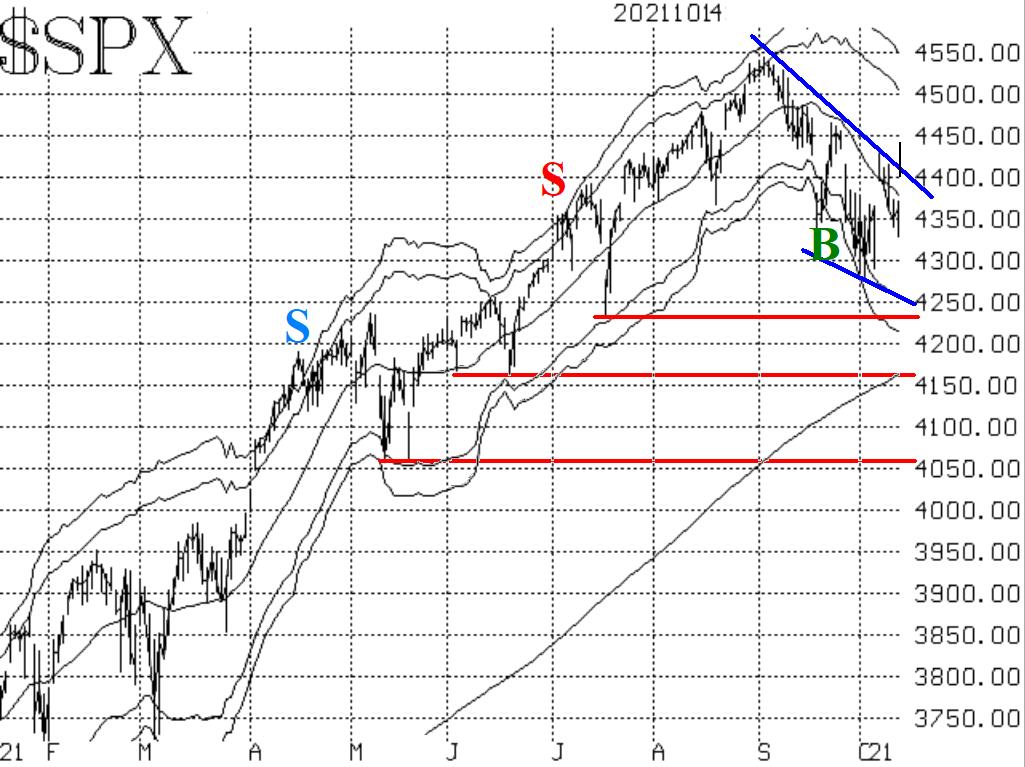
You can see from the chart in figure one that a strong, upward move in S&P 500 (SPX) probed through the downtrend (blue) line. Of course, that line is a bit arbitrary, but if SPX can climb above the late-September high closing at 4470 or higher, then that would be a clear breakout above the downtrend line. Until then, we are still keeping a reserved attitude toward the market.

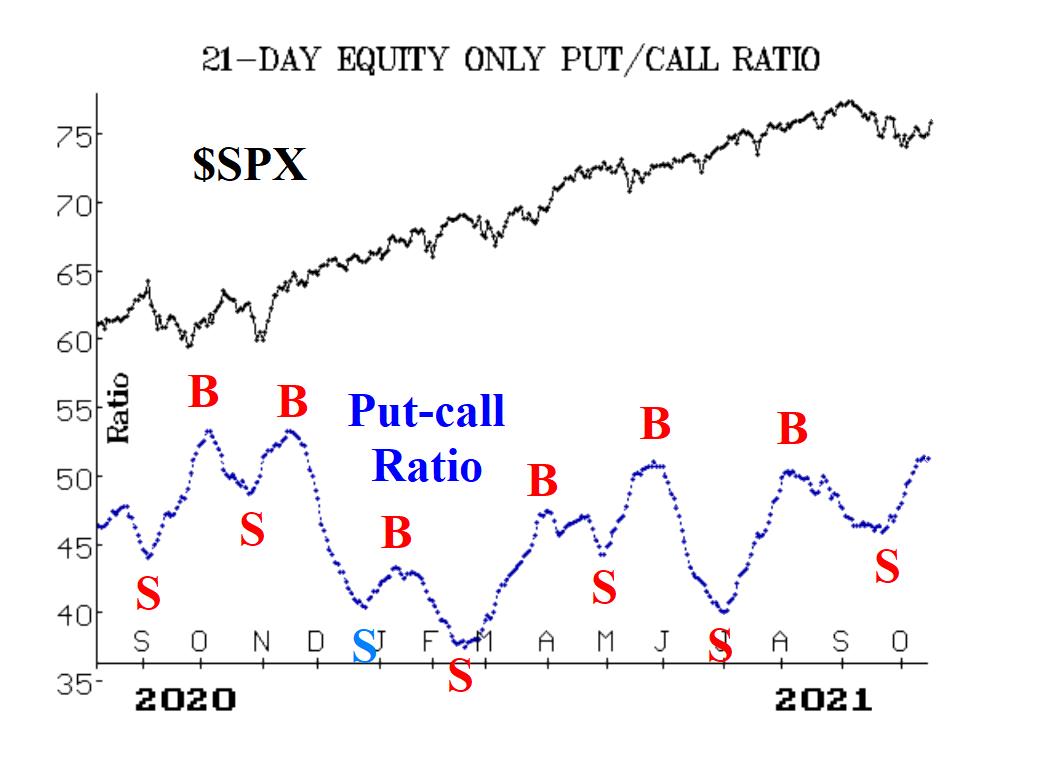
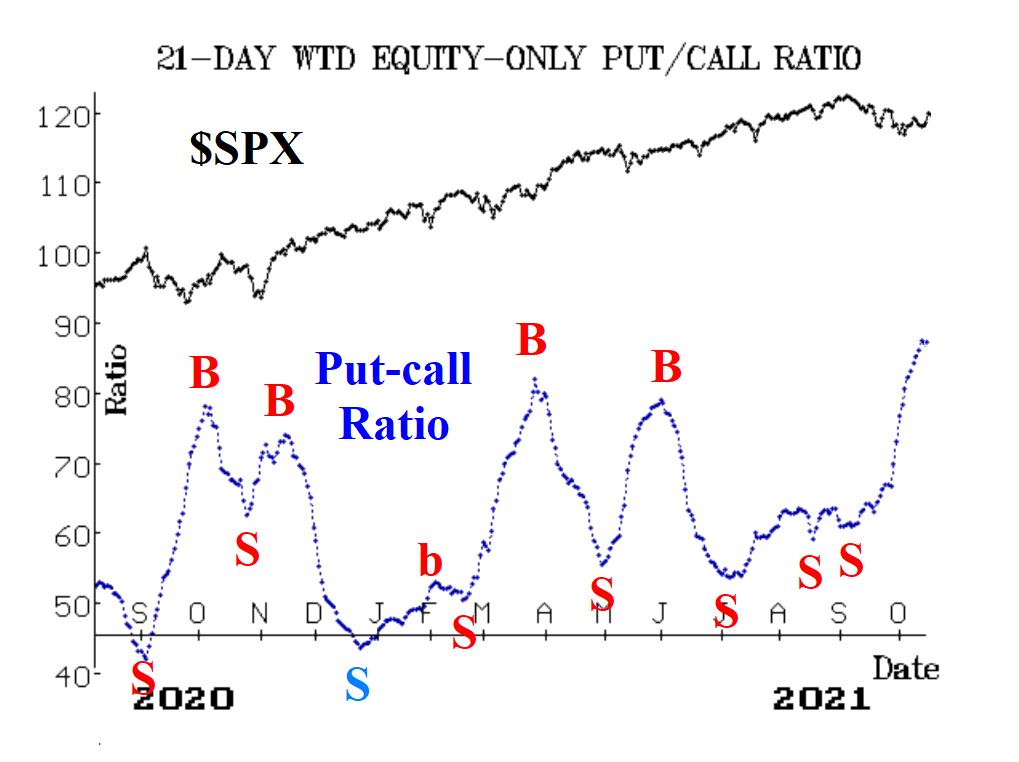
One of the indicators that is stubbornly bearish is the equity-only put-call ratio. Actually, both of these ratios are still bearish. They are rising, and will not generate a buy signal until they roll over and begin to decline.

On the other hand, breadth has been quite strong especially on a relative basis. It has been doing much better than SPX itself. As a result, our breadth oscillators remain on buy signals, but are now in overbought territory.

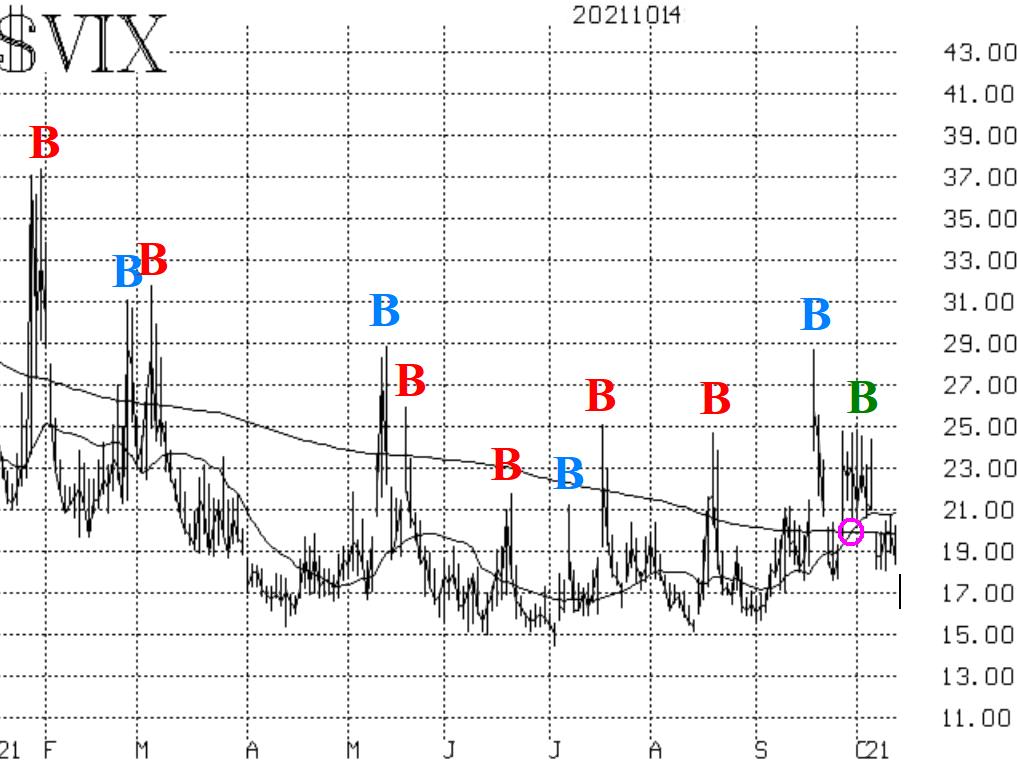
Implied volatility signals are mostly bullish at the current time. The CBOE SPX Volatility Index (VIX) "spike peak" buy signal remains in effect. In addition, the trend of VIX signal, which looked like it was turning negative less than a week ago, has reversed itself, and is no longer bearish.

In summary, it's beginning to look like the downtrend is in jeopardy, and it's back to (bullish) business as usual. We will trade confirmed signals as they occur and there have been both buy and sell signals this month. A close above 4470 would be bullish for SPX. Otherwise, the bears might still have a chance over the short term.


