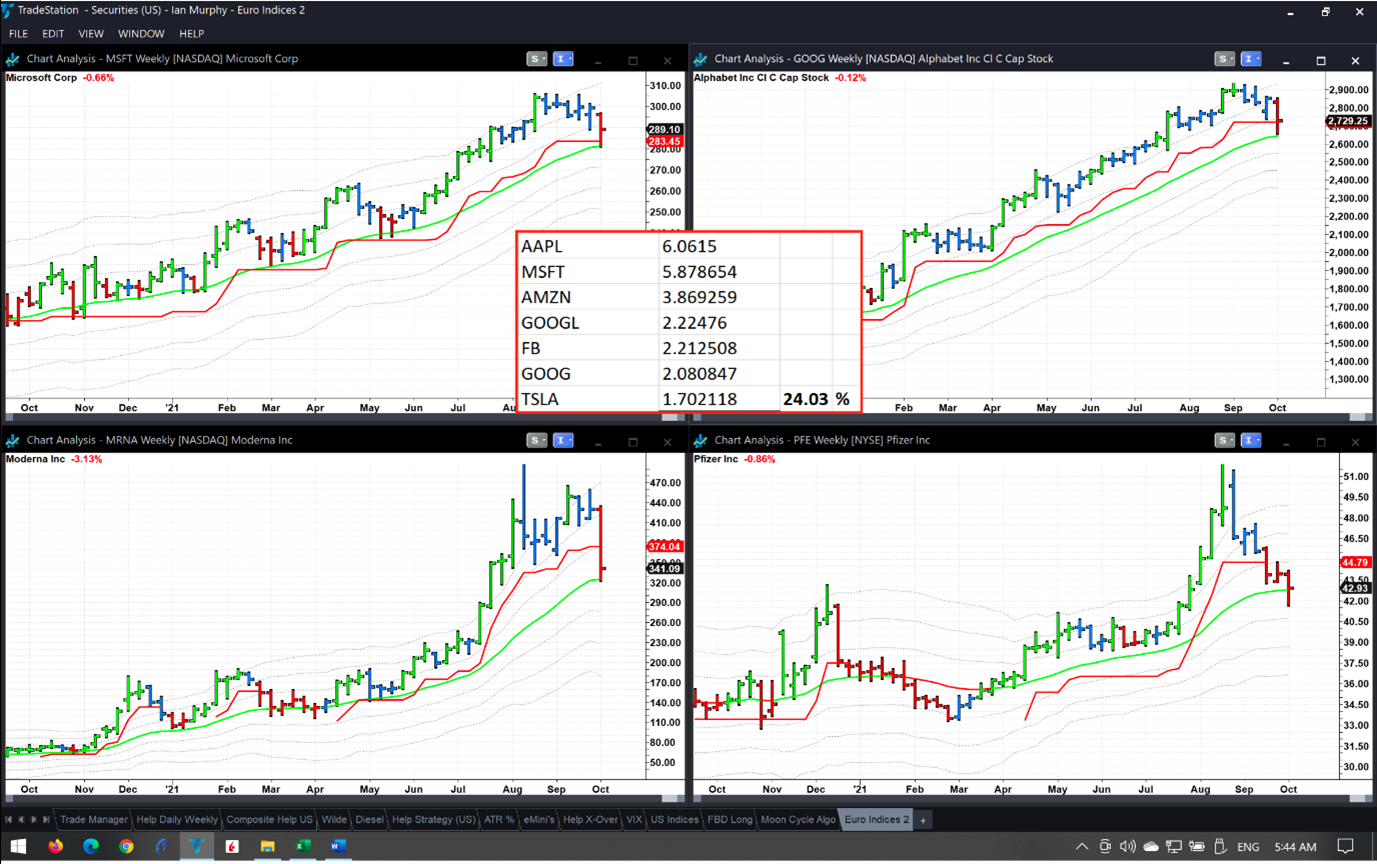
In recent years the weighting of stocks in the S&P 500 (SPX) has crystalized around a handful of tech firms, so when these firms move, “the market” as measured by this popular index also moves, states Ian Murphy of MurphyTrading.com.
Microsoft (MSFT) and Google (GOOG, GOOGL) are perfect examples. Both feature prominently in portfolios and they make up over 10% of the weight of the S&P 500. Last week both stocks pulled back and pierced their trailing stops on weekly charts (top) for the first time in over a year.

Cash cows for trend followers since the pandemic began such as Moderna (MRNA) also hit the buffers last week. And a long-term favorite for investors Pfizer (PFE) has also started to break down.
If the bull market in US equities is to continue these popular stocks will have to reverse course and start climbing again because they carry so much of the weight of the market.
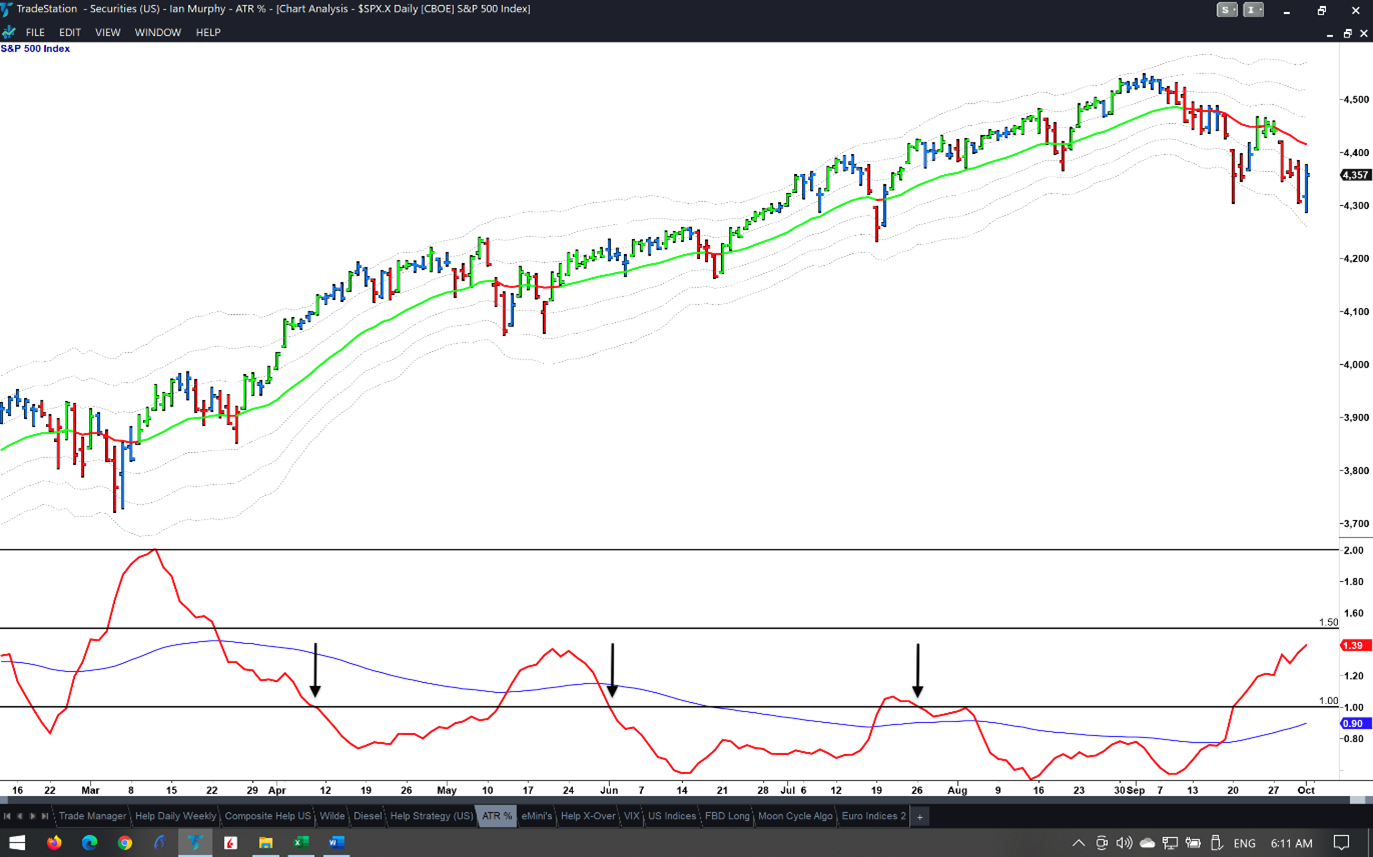
One of the “six signs of a trend change” is an increase in realized volatility as expressed by Average True Range Percent (ATR%). On an index like the S&P 500 an ATR% reading above 1% accompanies a pullback, and conversely the indicator falls back below 1% when the index resumes an upward path (black arrows). On this daily chart, the ATR% indicator was still rising on Friday.
So, we have key stocks breaking down and realized volatility increasing. These are not signs, which would imply the pullback is coming to an end. For the week ahead, only take A-grade trading setups and ensure protective stops are correctly positioned and active before the market opens.
Learn more about Ian Murphy at MurphyTrading.com.


