

Stocks are having a lackluster week as economic data have become subdued, explains Marvin Appel of Signalert Asset Management.
For example, the August employment report came in much weaker than expected, showing just 1/3 the predicted number of jobs added. The explanation for the miss was weak hiring in leisure and hospitality, blamed on the surge of coronavirus infections. Not all the news is bad, however. Weekly unemployment claims hit their lowest post-pandemic level on Sept. 9. Moreover, the August data would be considered strong in a normal setting, with twice as many jobs created as needed to match growth in the labor force and an unemployment rate of 5.2%.
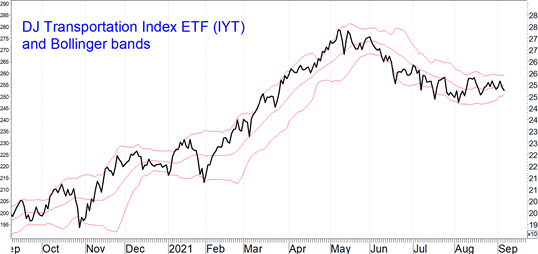
What counts for traders is how the market reacts, and what we have been seeing in recent months is decreasing confidence in the pace of economic expansion. For example, the chart below shows how the Dow Jones Transportation Average ETF (IYT) had an 11% correction from May 7 – August 4. (IYT has continued to lag the S&P 500 SPDR and the Nasdaq 100 ETF since then.)
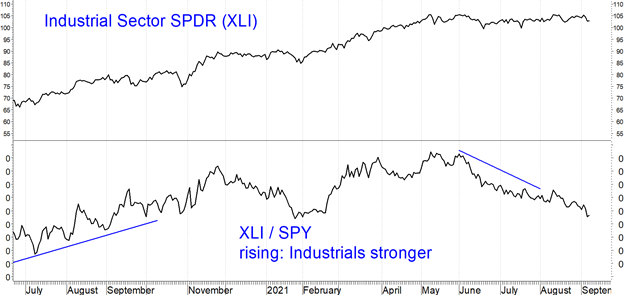
Industrials have also lagged for the past four months. The chart below shows the Industrial Sector SPDR (XLI) and the ratio XLI / SPY. When XLI / SPY is rising it means that industrials are outperforming the overall S&P 500 Index which is a sign that investors are betting on accelerating economic growth. From February-May this year (and from May-November in 2020), XLI was stronger than SPY but since May XLI has been weak, actually losing 2% from May 10-Sept. 7 while SPY gained 8%.
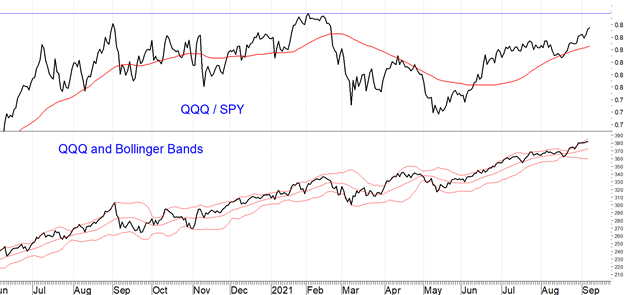
On the flip side of the market, the Nasdaq 100 Index ETF (QQQ) has been outperforming SPY since May (see QQQ / SPY in the chart below). In fact, QQQ / SPY is retesting its February peak. The large-cap technology stocks in QQQ have been de facto defensive stocks since the start of the pandemic, and outperformance by QQQ is a sign of economic pessimism. However, I would not recommend buying QQQ at current levels because they have become so overbought relative to SPY.
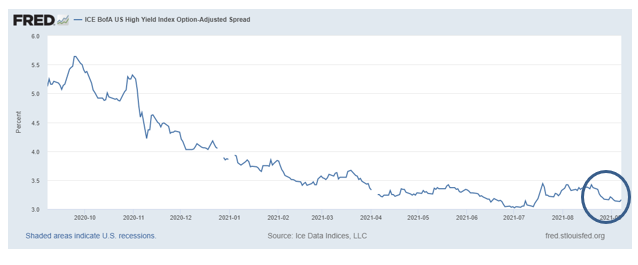
Fortunately, not all the news is bad. The spread between corporate high yield bonds and Treasury notes remains narrow, meaning that bond investors are not worried about default risks. (The circled area of the chart below of the high yield bond spread shows how spreads have narrowed from 3.42% on August 19 to 3.16% on September 7.) High yield bond spreads have narrowed a bit since economically sensitive ETFs (XLI, IYT) hit their relative strength peak in May. In other words, bond investors don’t seem as worried as stock investors about the implications of slower economic growth.
Implications
Our U.S. equity timing model remains on “hold” which historically has been an overall profitable condition for the S&P 500. As a result, we will maintain our current equity exposure. However, subjectively, it appears to me that we are due for an interruption in the stock market’s seven-month rally. Both upside and downside potential appear limited. In this situation, covered call positions seem appealing. If there is a pullback the call premium will mitigate losses, and if stocks hold their ground or advance, the positions will be profitable. I would suggest waiting for a modest retracement before opening new positions.
Recommended covered call ETF positions include writing calls that expire on October 15, 2021 on ETFs if they pull back to the following potential support levels:
- SPY at 440 (2.5% decline)
- QQQ at 369 (3% decline)
- XLP at 71.50 (1% decline, see Joon Choi article on XLP on page 4)
To learn more about Marvin Appel, please visit Signalert Asset Management.


