

In recent weeks I’ve discussed areas that started becoming problematic to the market, explains Jeff Greenblatt of Lucas Wave International.
For whatever reason, none of them went over the line to create terminal technical damage. Now we have a new threat. Some of you might call me a worrywart, suggesting I’m on the wrong side of a bullish wall of worry. I consistently tell you to trade what is in front of you. I understand that in an easy money environment where the Fed backs up everything, its awfully hard to take serious short positions. The market hasn’t been ready for that, yet.
Bottoms are not that complicated. The legendary late Mark Haines of CNBC called the 2009 bottom to within an hour right on the air. He was able to do that because he recognized when the “other shoe drops” and it feels like its going down and never coming back. Tops are more complex because fear drops like a rock, but hope dies slowly. Right now, many are calling for the continuation of the rally. One famed economic strategist even said we are on the cusp of “economic nirvana which should usher in the roaring 20s.” I’ll use that as my contrary indicator.
We’ll agree to disagree because it’s been my contention the only reason the market keeps going up is easy-money policies. There is no real production to speak of. Most readers to this space remember the lead into prosperity cycles of the 80s and 90s. Is there anything right now that remotely reminds you of or gives you the confidence the 80s or 90s is directly in front of us?
First of all, let me remind you of The Fourth Turning book. We are in the midst of that 80-year war and revolutionary cycle, which has been confirmed time and time again. So, it is with that spirit I’ll continue to talk about the warning signs as we get close to September, the traditional graveyard for stocks.
Case in point this week is the housing numbers. According to CNBC (and others), sentiment among single-family homebuilders dropped 5 points to 75 in August based on the National Association of Home Builders/Wells Fargo Housing Market Index. These numbers include prospective buyer traffic and current sales conditions, which each dropped 5 points.
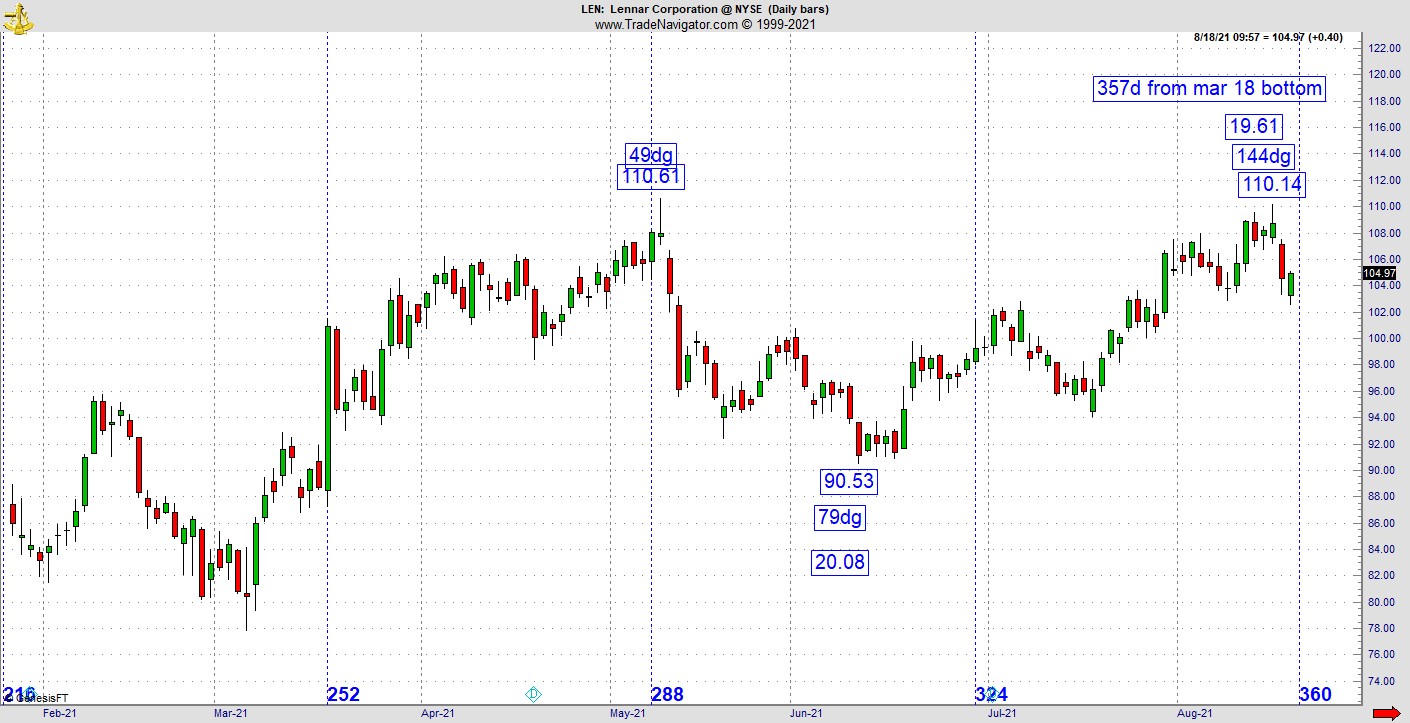
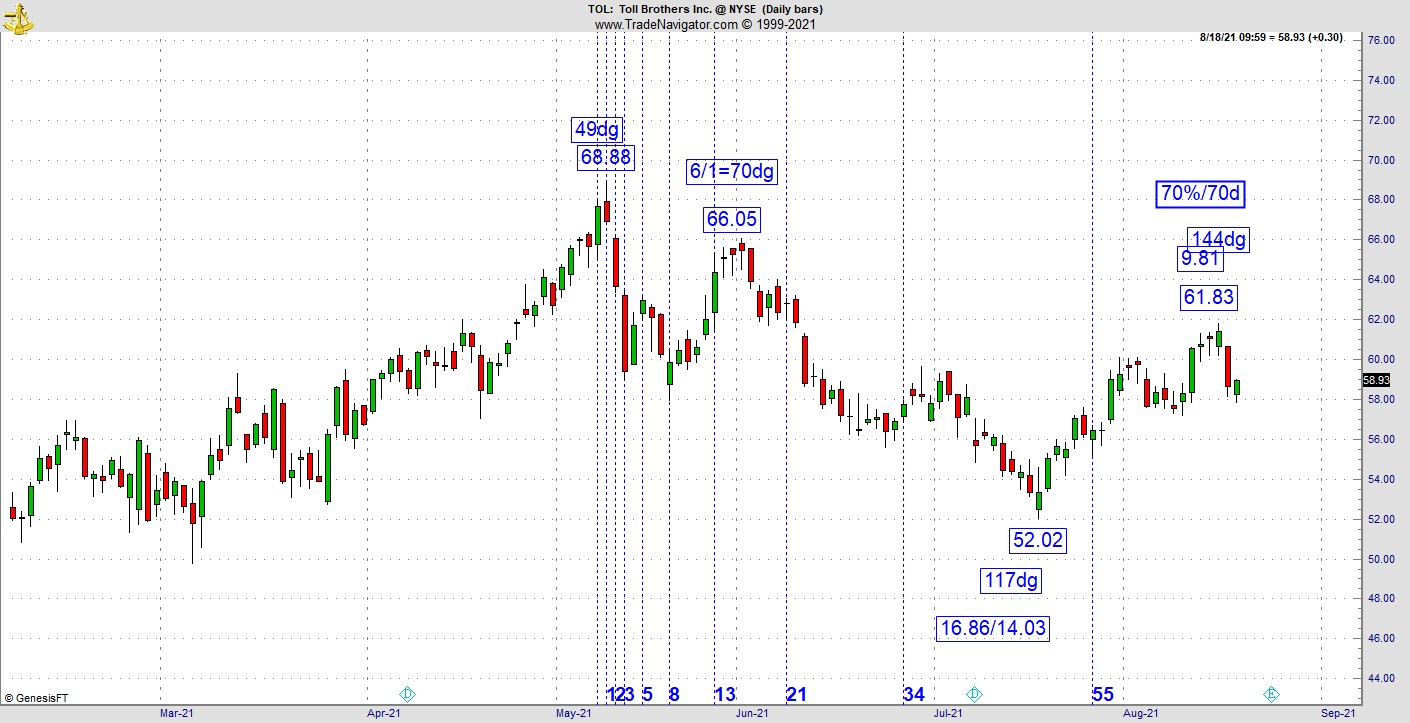
But my interest is always in the charts. That being said, a couple of housing stocks caught my attention. First is Lennar Corporation (LEN), which hit a secondary peak at 357 trading days from its 2020 bottom on March 18, 2020. Want to guess what March 18 is on the Gann calendar? It is the 357th vibrational day. It put in an evening star right on the button. Then we have some really interesting readings on Toll Brothers (TOL), which just achieved a 70% retracement back to the secondary high on June 1, which was the 70dg vibrational day. This August 16th high is also 70 trading days back to the original high. Even the HGX is showing interesting readings with the reaction. We can get news events but when I see it supported by price and time vibrations, it’s time to take it seriously.
Let’s just say these indications do not automatically bring on the pain. The HGX peaked in 2005 yet the overall market at large topped in 2007. As it turns out LEN has a perfect match since it bottomed several days before the rest of the market on March 23, which is 2dg reading on a new Gann calendar year. What I find interesting is the fact the entire market is coming to 360 trading days off that bottom early next week. If we continue down from here, there is a chance the market could invert and create a low by then. Whatever the case, the numbers on LEN are to be ignored at your own peril and it may even present an interesting opportunity to build a short position.
I can’t remember a single time the economy prospered while housing went into the tank. That being said, for a long-time, homebuilders rightfully complained about the parabolic nature of the lumber chart. With lumber prices plummeting, that is no longer the culprit.
Finally, do you want to know a high probability way of staying on the correct side of the move? This week’s case in point was early action in Tuesday’s Dow futures. Vibrational square outs not only give you great trading setups, but they also alert to when there is a problem in the market. In early trading after one selling wave there was a great vibrational setup on the secondary. You may or may not understand this based on whether you’ve been following my price and time lessons of the past couple of years. There was a low at 377 points down. A bounce of 176 points led to a 76% retracement. In a good bullish environment, this is the type of setup that leads to rallies that could last the rest of the session.
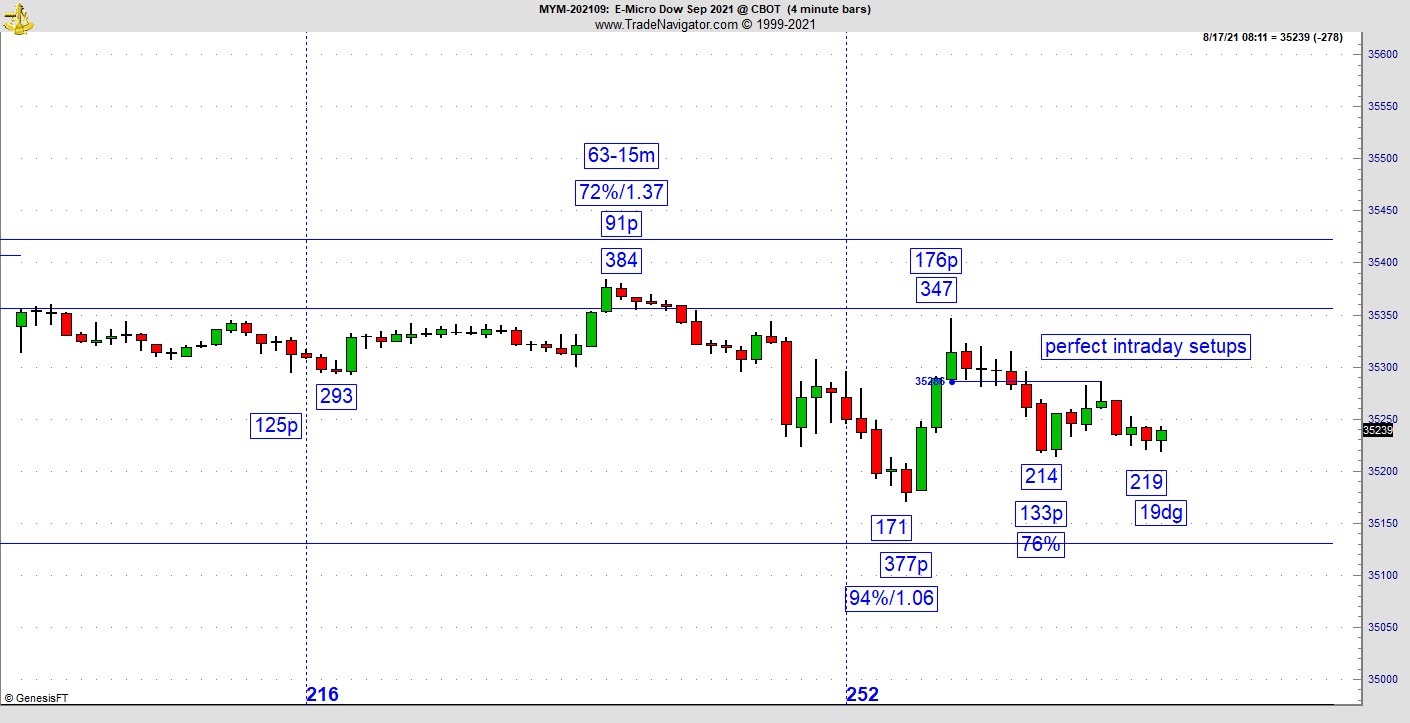
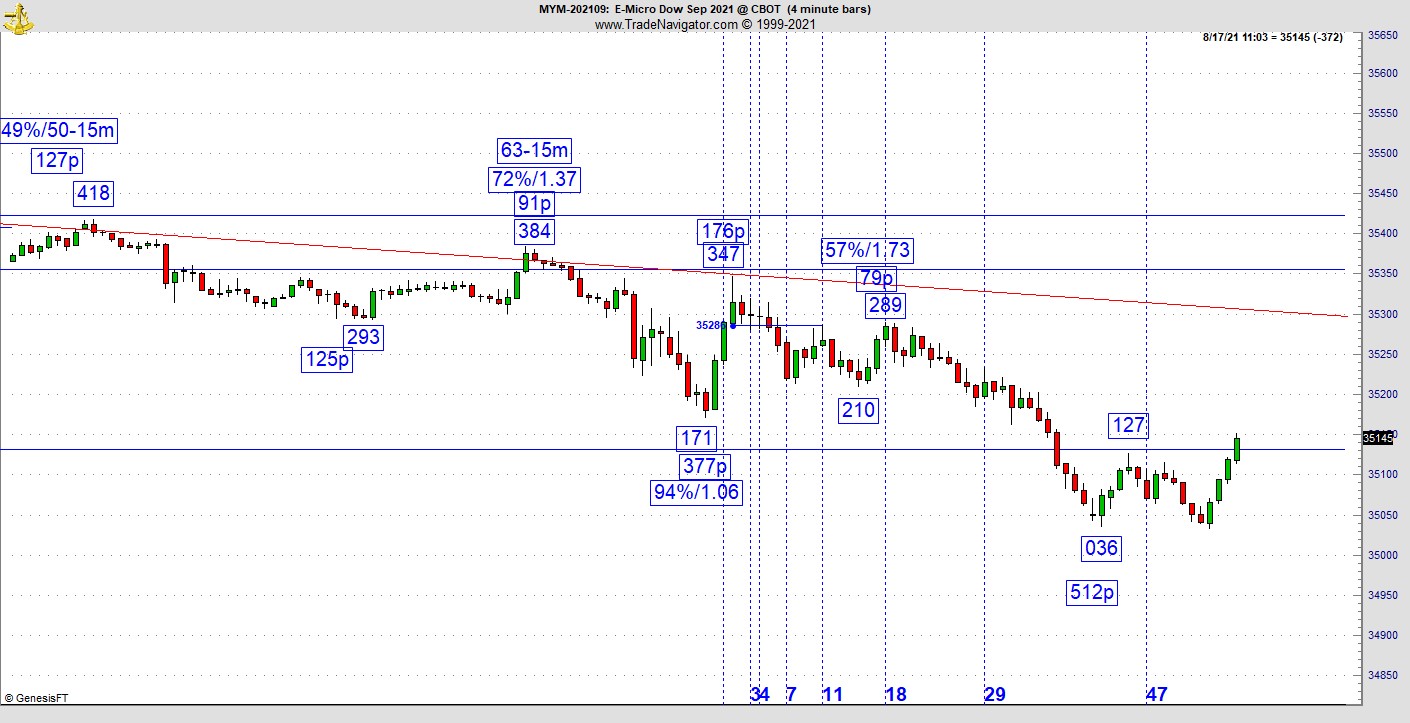
When it didn’t go, that was an indication of trouble. Big institutional traders will test a support or resistance level to see if the crowd will go along. Depending on what happens they’ll either stick with the position or pull it quickly. Do you have an indication the market is not behaving correctly? When a good setup failed, I knew it was time to stay or get short again. The pattern could not break through and ultimately ended up several hundred points lower. Ultimately what turned this market up was an 84% retracement at 84-15min bars lower. But the damage was already done by that point. One of the features of using price and time vibrations is they are an excellent indicator of what Bill Williams (Trading Chaos) called a “new bit of information.”
Watch housing stocks very closely. If this sequence turns out to be a mirage it's no harm, no foul. If not, we could have a September not to remember but one we’ll want to forget.
For more information about Jeff Greenblatt, visit Lucaswaveinternational.com.


