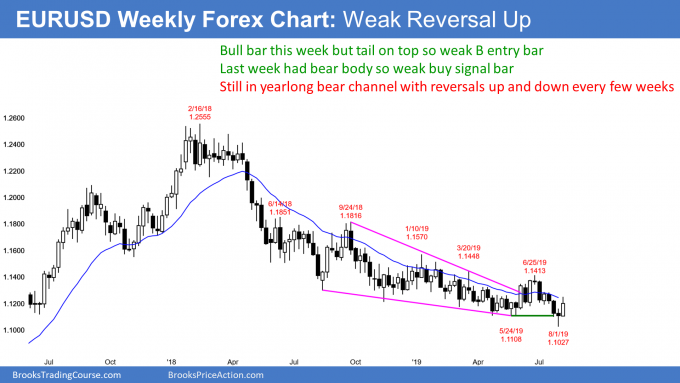
The EURUSD reversed up from below its five-month trading range on its weekly chart, but likely will remain range bound, reports Al Brooks.
The EURUSD reversed up strongly last week on its weekly chart after a break below the five-month trading range (see chart). That break was a reminder that the yearlong bear channel is still intact. The bulls need a strong breakout above the June high to make traders believe that the bear trend has finally ended. Without that, traders will continue to look for a reversal after every two- to three-week leg up or down.

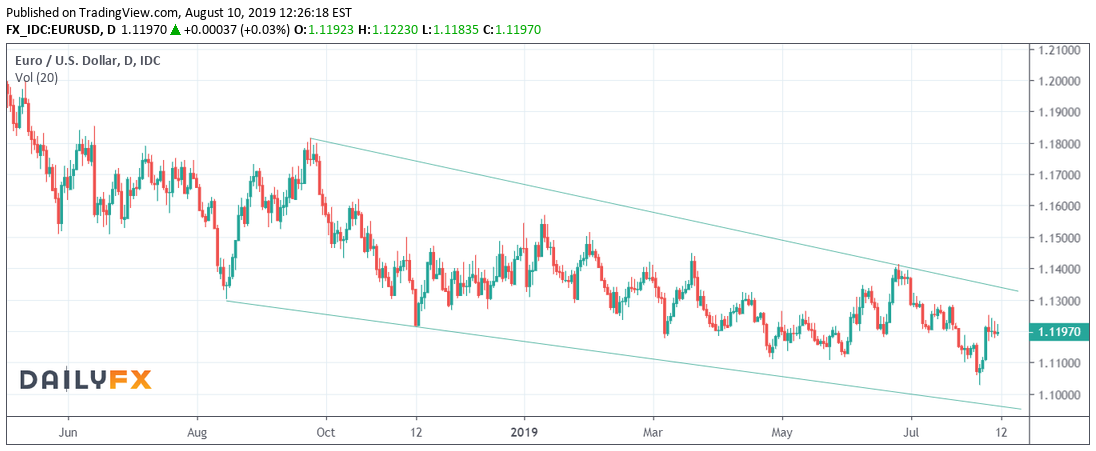
Last week’s reversal up on the daily chart (not shown) was strong enough to make a second leg up likely. A reversal down from here will probably only last about a week before the bulls buy again.

Reversal up from Spike & Channel Bear Trend
The selloff from the June high on the daily chart formed a Spike and Channel Bear Trend. Traders see the July 11/July 19 double top as the start of the wedge bear channel. When a Spike and Channel Bear Trend reverses up, traders expect a test of the start of the channel. That means they will buy the first reversal down and look for a rally to around 1.1280 (July high).
If the current leg up continues to 1.1280 without more than a day or two pullback, traders will expect the first pullback to lead to a test of the next resistance. That is the June high of 1.1413.
Can last week’s high be a lower high that reverses down to below the August low? The momentum up last week makes it likely that bulls will buy the first three- to five-day reversal down. Consequently, a higher low and then a second leg up is a more likely outcome.
Trading Room
Traders can see the end of the day bar-by-bar price action report by signing up for free at BrooksPriceAction.com. I talk about the detailed E-mini price action real-time throughout the day in the BrooksPriceAction.com trading room. We offer a two-day free trial.


