Crude oil finally reached its highest reasonable target last week, writes Al Brooks.
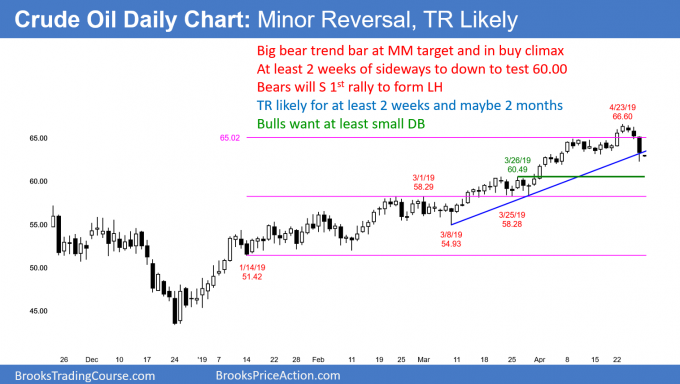
Every week for four months crude has rallied. Now, there will probably be at least a two-week pullback to $60.
The crude oil futures turned down last week with a big bear trend bar on the daily chart (below). This will probably lead to at least a couple small legs down to $60 over the next two weeks.

Once there is profit taking after a buy climax, the chart usually enters a trading range. The pullback could last a couple of months. It might even test the start of the channel at the March 8 or Jan. 14 lows.
In December, I said that the December trading range would probably be the final bear flag. For the past four months, I wrote every week that there was no top, and that the rally would continue. Last week, I said that the rally would probably end around the $65 measured move target.
Friday’s big bear bar is a sign that the bulls are taking profits. Those who did not, now expect a second leg down. They will use a bounce to sell out of their longs.
Friday was a surprisingly big bear day in a buy climax. A bear surprise bar typically leads to at least two legs down. Traders will sell rallies for at least a couple weeks.
Trading Room
Traders can see the end of the day bar-by-bar price action report by signing up for free at BrooksPriceAction.com. I talk about the detailed E-mini price action real-time throughout the day in the BrooksPriceAction.com trading room. We offer a two-day free trial.


