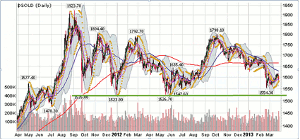
Gold prices are finding themselves stuck in a downward channel now since hitting $1798 per troy ounce in October 2012, writes Andrew Klips on Equities.com.
A series of lower-highs and lower-lows has followed, forming a steady pattern as part of a longer-term trend since gold prices peaked at $1,923.70 per ounce in September 2011.
In Wednesday trading, gold bullion was off by about half a percent at $1,598.10. Gold prices have only closed above the 50-day moving average (blue line on charts below) on three occasions since breaking back below it on September 23. Although prices have climbed all month, as they approached the key moving average again at the end of last week, prices are once again getting repelled downward. It looks like trying to push two like magnets together.
If the slide continues, gold will find itself back down on a firm area of support in the near term. After hitting all-time highs early in September 2011, gold prices promptly plunged to bounce off $1,535 later the same month. In its downward progression, it has bounced off, $1,523 in December 2011; 1,526 in May 2012; and even bounced off $1,554 last month.
So, in short, something is going to have to give soon as the 50 DMA is moving downward. Either gold prices will push through it or that support (let’s say low end of $1,523 from Dec. 2011) will inevitably have to cave.
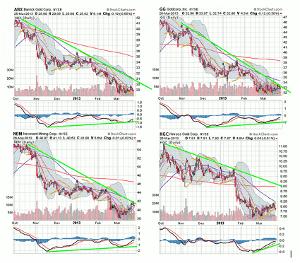
Some major gold plays also look to once again be trying to hold a base at their respective levels. The interesting technical point is that many of them are showing a positive divergence between the moving average convergence/divergence, or MACD, and the sliding prices. The MACD is a widely used gauge of trend and when it is ascending towards zero, it generally is signaling that a trend shift may be coming. A break of the zero line is often referenced as “breaking the money line” because the chart has moved into a bullish trend.
Of the four charts shown, only Kinross Gold (KGC) is not showing a positive divergence (price per share moving down as MACD climbs). The MACD in KGC’s case has only started to rise with the price per share over the past month. Barrick Gold (ABX), Goldcorp (GG) and Newmont Mining (NEM) are all seeing the MACD trend upward and getting near “the money line” at this point.
Now it’s important to note that the MACD couldn’t break through in any of the charts above on attempts since the first of the year, underscoring the overall bearishness in the charts. It should also be noticed that the 50 DMA has acted like kryptonite on Superman in the case of these companies as well.
Is this the time that they make the stronger move and gain the support of the bulls to rise from these technical bottoms? Technically speaking, it’s certainly worth the time to follow along and see if the push is coming to recover at least a portion of the substantial losses in the past six months (and more).
By Andrew Klips, Contributor, Equities.com


