With the Dow breaking record highs on consecutive days, eyes now turn to the other indices in anticipation of their notching up similar gains, and the staff at bespokeinvest.com takes a look at stocks comprising the Russell 1000 and S&P 500.
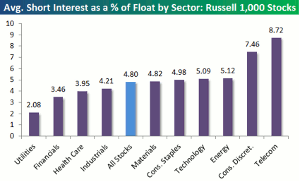
Below is a look at the most and least heavily shorted sectors in the market. As shown, the Telecom (XTL) sector is the most heavily shorted with the average stock having 8.72% of its float sold short. Consumer Discretionary (XLY) ranks second with a SIPF (short interest as a % of float) of 7.46%. Materials (XLB), Consumer Staples (XLP), Technology (XLK), and Energy (XLE) are all bunched up with SIPFs between 4.8% and 5.1%, while the average SIPF for all stocks in the Russell 1,000 is 4.80%. Utilities (XLU) is the least shorted sector, and it may surprise some to see the Financial (XLF) sector as the second least shorted.
Average Short Interest Table
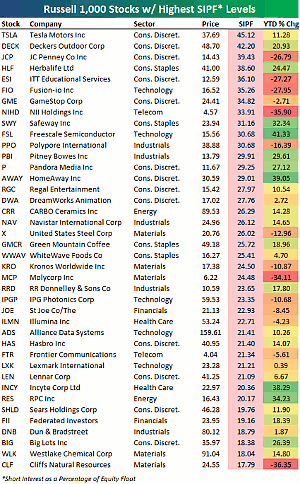
Below is a list of the 40 stocks in the Russell 1,000 with the highest short interest as a percentage of float. As shown, Tesla Motors (TSLA) is the most shorted Russell 1,000 stock with a SIPF of 45.12%, followed by Deckers Outdoors (DECK), JC Penney (JCP), and Herbalife (HLF). Some other notables on the list include Pandora (P), US Steel (X), Green Mountain (GMCR), Hasbro (HAS), and Sears (SHLD).
We also highlight each stock's year-to-date percentage change, and there are a lot of big winners and big losers on the list. Stocks like Safeway (SWY), Freescale Semi (FSL), Pandora (P), and HomeAway (AWAY) have crushed the shorts so far in 2013 by posting big gains. Stocks like JC Penney (JCP), ITT Educational (ESI), Fusion-io (FIO), and NII Holdings (NIHD) have rewarded the shorts by posting big declines.
Russell 1000 Top Short Interest Table
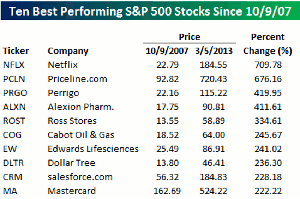
Ten Best S&P 500 Stocks Since 10/9/07
While the S&P 500 (SPX) (SPY) still has a little bit of a ways to go before it takes out its all-time closing high from 10/9/07 (1,565.20), we wanted to take a look at the stocks in the index that have done the best since then. The table below lists the ten best-performing current members of the S&P 500 since 10/9/07. Topping the list is Netflix (NFLX) with a gain of 709.78%. Although it has been a rocky road over the last couple of years for NFLX, investors in the stock have done quite well over the last five-and-a-half years even as investors in index funds are just about flat (dividends not included). Running a close second to NFLX, shares of Priceline.com (PCLN) have rallied 676% since the S&P 500's all-time closing high.
Top S&P 500 Stocks Since October 2007
What is most notable about the ten names above, however, is that none of them were actually in the index on 10/9/07! In other words, not a single stock that was in the index the last time the S&P 500 made a new high made the top ten list in terms of performance since then. Of the stocks that were actually in the index on 10/9/07, the best performing stock only did well enough to place 11th overall.
By the Staff of bespokeinvest.com


