Trader and blogger Brian Lund of BCLund.com shares the charts of some stocks that he sees exhibiting relative strength lately.
The markets got a nice bounce last week, however due to the short holiday week and volume being less than desirable, that bounce is guilty until proven innocent.
The name of the game since this market decline started has been “relative strength,” and there are a number of charts that are showing that in spades, but first let’s take a look at some sector action.
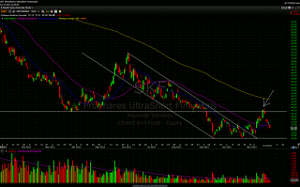
SKF
Two weeks ago I wrote, “After being in a down channel for six months, SKF put in a double bottom and broke out of that channel. If it breaks resistance at around $39.50, that would not be a good thing.” Fortunately it failed that breakout (see arrow on above chart).
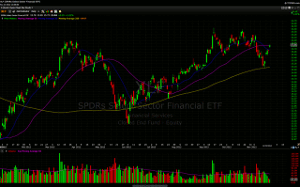
XLF
The analog twin to SKF, the XLF made a nice bounce off its 200ma, which hopefully means the financials have more gas in their tank.
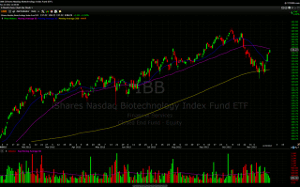
IBB
The biotechs were hot, hot, hot this year but got taken down when the market decline started. The $IBB, however, did a “double tap” at the 200ma and bounced nicely. Need to see some consolidation first, but that could set up another run in this sector.
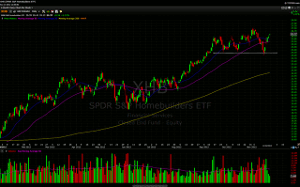
XHB
Another hot sector this year as been the homebuilders. XHB found support last week and looks like it is poised to go higher.
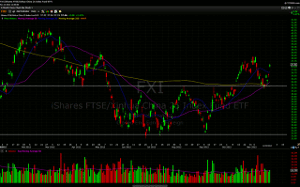
FXI
About two months ago, I noted that the FXI seemed to have found a bottom. After a nice breakout it pulled back to support and the 200ma and bounced well, which is good price action.
So let’s take a look at some individual stocks.
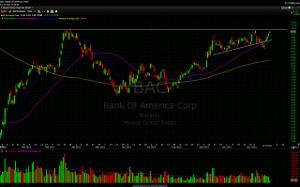
BAC
After a small head fake, BAC has resumed its upward movement and looks like a buy above $10.00 if it can break out with volume.
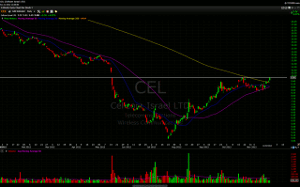
CEL
I don’t know anything about CEL, but it’s been basing right below gap resistance and has broken its 200ma for the first time in about two years.
NEXT PAGE: More Charts of Stocks Showing Relative Strength
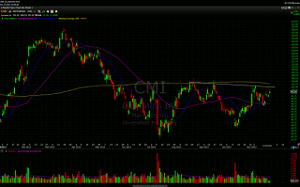
|pagebreak|CMI
Looking like it may have put in a bottom, CMI will have resistance right at the trendline and the 200-day moving average. Breaking out past both those could ignite a nice move up.
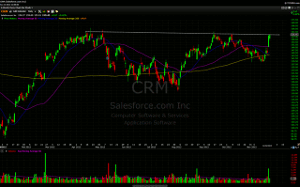
CRM
The monthly chart of CRM looks even better as it is getting near all-time highs. A break above the trendline with volume is the buy point.
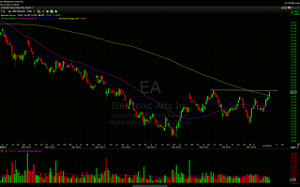
EA
Recapturing the 200ma is a good sign for EA. A couple of days of sideways action below resistance would set up a nice long trade.
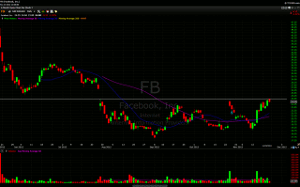
FB
Will it or won’t? Who knows, but if you want to play it long, there is a clear line in the sand here for FB.
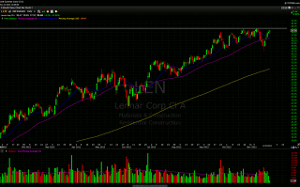
LEN
In the homebuilders, LEN looks the best as it consolidates right below a five-year high.
MA
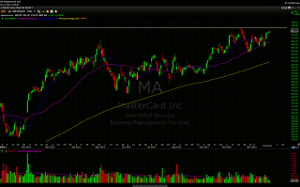
Tough to trade at times, but MA is a powerhouse basing just below all-time highs.
MAS
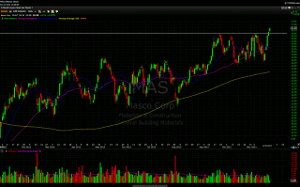
Materials and construction go hand in hand with homebuilders, so it’s not surprising that MAS is breaking out here.
NFLX
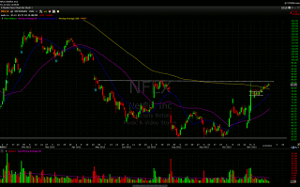
This slow, wedging action out of the flag is technically bearish, but if NFLX can break $85.00 with any conviction, a lot of short sellers are going to have to cover, which could squeeze this thing higher very quickly.
NTE
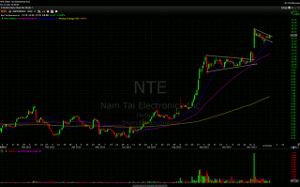
A little head fake out of the flag, but price came right back in, which makes the chart in NTE still look good.
TEX
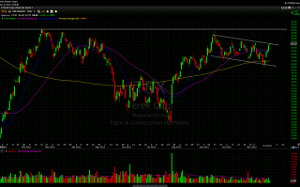
I like the action in this channel for TEX. A measured move out of it could take the stock to the $29.00-$30.00 area.
TIVO
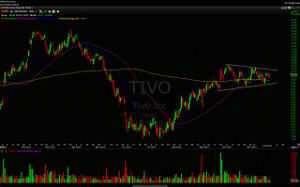
After coming off a bottom in July, the price range in TIVO continues to get narrower, indicating a big move is coming.
By Brian Lund of BCLund.com


