The Commodity Channel Index (CCI) is useful for analyzing overbought and oversold conditions, writes Brandon Wendell, CMT, but its lagging nature makes it an unreliable generator of buy and sell signals.
As a Chartered Market Technician (CMT), I get a lot of questions about technical indicators and how they work. In one class, I was asked about the Commodity Channel Index (CCI) indicator because some of the students noticed I had it on my charts.
The first thing I want to mention about technical indicators is that they are all lagging and are not to be used as decision-making tools. In other words, when they give their buy and sell signals, it will always be at least one candle after the optimal entry point in price.
So how can we use these indicators? They can be useful as a decision-support tool. Identifying divergence on an indicator or determining that you are in an overbought or oversold situation can help you identify high-probability opportunities in the markets when price is at supply or demand.
I mentioned the terms overbought and oversold. I should explain what these mean. The CCI falls into the family of indicators known as oscillators. Oscillators typically have a level that marks overbought and oversold.
In the case of the CCI, price of the security is overbought when the indicator reads over +100. This means that price has risen so much so fast that it has deviated from the average price much more than normal. There is a high probability that this movement is unsustainable and that it will snap back to the average soon.
The CCI oscillates above and below zero. When the CCI reads below -100, then price is said to be oversold. It has sold off to the point that it has dropped well below the normal deviation from the average. Price is then unsustainable and is highly likely to snap back to the average soon.
In all, the CCI measures how far price is moving away from an average price. If we become overbought or oversold, then price exceeds the normal movement (the standard deviation) away from that average.
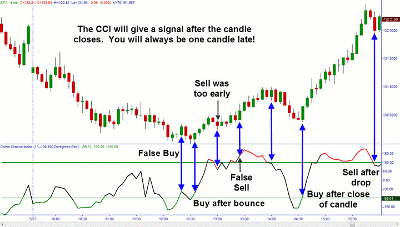
The traditional buy or sell signal would be when price crosses the +100 or -100. As you can see from the picture, however, this will always be either late or false.
So how do I use this indicator? I use it in two ways. First, I feel I have a higher probability for trading success if I buy fresh demand levels where the CCI is also oversold. I buy when price is in the demand zone and do not wait for the indicator to signal buy. I would also feel more confident selling a supply zone if the CCI is showing oversold. Once again, I cannot wait for the traditional sell signal, as it would arrive very late.
NEXT: The Best Signal Offered by the CCI Indicator
|pagebreak|
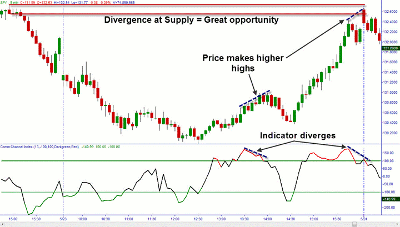
Probably the best signal I could receive from the CCI is when it is showing divergence from price. In a strong uptrend where price is making higher highs and higher lows, the CCI should as well. If price is reaching a supply zone but the CCI is making the same or lower highs as it did on a previous price peak, then it is diverging, and that is a strong sell signal to me.
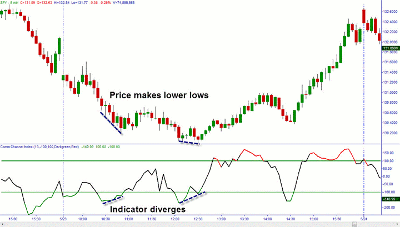
When I am looking to buy after a drop in price into a demand zone, I look for divergence in the CCI where it fails to make lower lows while price does.
So now you see why I have this CCI on my chart. I use it to help confirm entries and exits but never as the decision maker itself. I will always defer to price and trade at supply and demand zones. That is how you can succeed in trading.
By Brandon Wendell, instructor, Online Trading Academy


