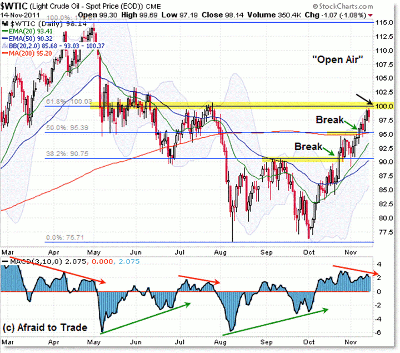
Oil put in a stellar upside performance from October to present, and now faces yet another “resistance challenge” (it’s passed the others so far) into the $100 price resistance confluence.
Let’s view three timeframes of crude oil to see what to look for and what might come of the “Battle for $100.”
The main idea at the moment is that crude oil prices have rallied steadily into the $100 triple resistance confluence. It’s triple daily chart resistance due to the July swing high, 61.8% Fibonacci Retracement as drawn, and the simple round number resistance at $100.
Does that mean price is guaranteed to turn down here? No—just look at how price initially stalled in late October and broke through in early November above the double confluence (200d SMA and 50% Fibonacci) at the $95 level.
We also see an initial breakthrough in late October of the $90 level—38.2% Fibonacci and September swing high.
Inflection points like these tend to be good spots to initiate trades—bears who believe resistance will hold can enter and place a tight stop above the confluence and play for a larger downside target than the small stop.
Of course, bulls/buyers can enter a breakout trade as price breaks, then holds above a key visual resistance area.
Breaks above resistance tend to trigger popped stops, wherein short sellers are forced to buy back their positions to cover, which joins with the eager breakout buyers to create a feedback loop (impulse move).
A similar situation exists now at $100—price is either going to retrace down/stall here, or shatter higher through it, pushing through the “open air” particularly if price can clear $105 soon. Thus, a clean upside break suggests price could eventually retest the $115 region.
A downside reaction here suggests otherwise (the initial target would simply be the $95 confluence, then under $95 targets the $90 confluence).
Let’s take a quick step inside the daily price action to see two timeframes of intraday charting:
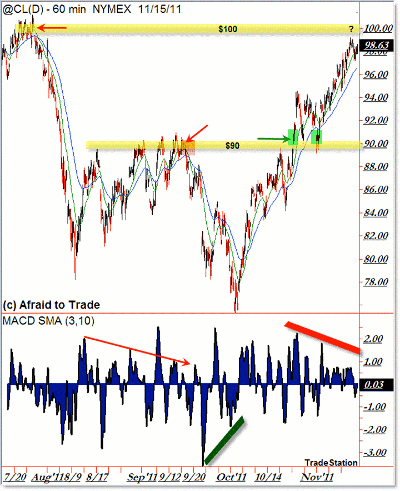
I wanted to show the hourly chart to give a broader perspective of the last few months in crude oil, complete with divergences and key price levels (mainly $90).
You can see how price formed a lengthy divergence and reversal initially into $90 in September, then reacted lower from the $90 target in early October, which gave way to the final breakthrough in late October.
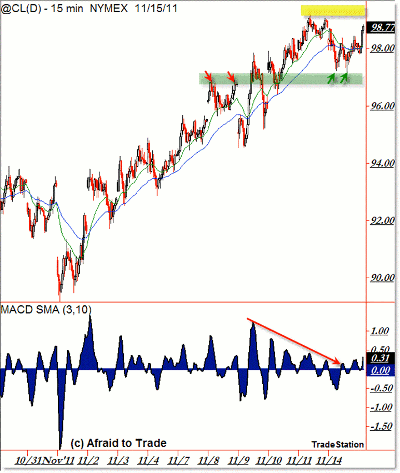
We’re seeing a similar, lengthy negative divergence into the $100 area, which is seen best on the 15-minute chart:
The 15-minute chart shows us the strong rally from $90 to $99 in November, and zooms in on the divergence in momentum.
It also highlights a short-term support shelf to watch at $97, which recently became a polarity level.
The odds for reversal increase if oil trades under $97, though while price hovers above $97, price is in that key “make or break” neutrality zone between the $100 resistance (bullish bias above) and $97 support (short-term bearish below).
The resolution should be interesting, so at least monitor this situation if you’re not trading oil at the moment.
Corey Rosenbloom is a trader and blogger at AfraidToTrade.com.


