System traders may want to test this methodology, which is based on an easy-to-follow RSI pullback and generated very good results in a lengthy backtest study that spanned both bull and bear markets.
Want to save yourself the trouble of looking for the "perfect" stock trading system? Are you looking for a simple, time- and stress-tested way to earn steady profits, simply by clicking a few buttons in your trading platform or online brokerage account?
Even though there are no perfect trading systems or methodologies, and even though the stream of dubious stock advisory newsletters won't ever stop arriving in your mailbox, there really are trading systems available to you that are simple to use and that are likely to deliver steady profits over long periods of time.
No, it won't be as simple as punching a button or two, and yes, you must have the psychological fortitude to faithfully execute such methods (if you can follow a few simple rules all of the time, no exceptions) if you hope to reap the gains possible by trading a structured, disciplined, systematic approach to trading the stock market. Here's a brief look at one way to accomplish this.
Using a basic Metastock/TradeSim exploration, I ran a simple relative strength index (RSI) pullback system, one that takes long trades only and attempts to profit from a snap-back move higher in a given stock. One hundred large-cap stocks were used in the nearly 20-year backtest, with all stocks used having been listed since at least January 1, 1991.
Here's the code for the RSI pullback exploration in Metastock. If you don't use, Metastock, this won't mean much to you, but you should be able to do a similar study in your trading platform of choice.
- Column A name: CLOSE
- Column A code: CLOSE
- Column B name: Long
- Column B code: (Cross( RSI(5),18)AND CMF(89)>(0))
- Column C name: Exit
- Column C code: (Cross( 75, RSI(5)))
In simple terms, all this exploration is looking for are stocks with strong long-term money flow (in this case, based on an 89-day Chaikin money flow indicator) that have made a pullback of some degree. Metastock users can simply copy and paste the code into Metastock Explorer; users of other charting/system development packages should be able to easily adapt the code for their own situation as needed.
Starting with a hypothetical starting account balance of $20,000, I tested 100 large-cap stocks starting on January 1, 1991 with this basic strategy and also added a 6% fixed stop loss for every trade.
Additionally, I set up the backtest to limit the maximum number of positions held to eight and allowed no more than two new trade positions on any given trading day no matter how many trading signals were generated. A fixed allocation of 12.5% of account equity per new position (8 positions x 12.5% being equal to 100%) was also specified. Finally, a commission of $.01 per share was also included in the mix, which is similar to the per-share pricing regimes at Interactive Brokers and TradeStation.
So, how did the RSI 5x5 system do during this nearly 20-year back test, anyway?
NEXT: See This System's Impressive Backtest Results
|pagebreak|Considering that we've seen two major bull markets and two major bear markets since the early 90's, the results are very, very encouraging. Running the backtest through a 10,000-pass Monte Carlo simulation, here are the results:
- Average number of trades: 1,943
- Average profit: $75,587 with a standard deviation of $3,732
- Average number of winning trades: 52.52%
- Maximum absolute percentage drawdown: 13.99%
- Average absolute percentage draw down: 6.80%
- Approximate compounded annual return: 8.70%
(Test figures obtained from Compuvision's TradeSim Enterprise add-on for Metastock)
Maybe 8.70% annual returns won't exactly light your fire, but consider how impressive these returns are, especially given how severe the bear markets of 2000 and 2007-2009 really were, and now you realize that maybe you're on to something here.
Also, note how modest the maximum absolute percentage drawdown was (closed equity basis), coming in at less than 14%.
Of even greater import is the low standard deviation of the average profit figure. In simple terms, 68% of the time during the 10,000 Monte Carlo runs, the system would have returned average profits ranging from $71,855 to $79,319. Meanwhile, the absolute best run maxed out at $89,074 and the worst-performing run still managed to return $59,043.
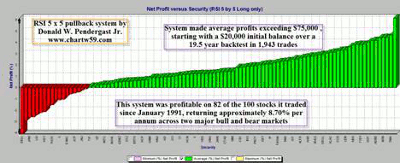
Below, witness the histogram that shows the average performance of each stock used in the test. It's overwhelmingly in favor of positive returns over the long haul, and is very convincing evidence as to the internal stamina of this incredibly uncomplicated trading system.
Only 18 of the 100 stocks tested failed to return a net profit over this nearly two-decade-long backtest. Lots of green and very little red-just what you want to see in a test like this.
Are there ways to improve this system? Absolutely! You can screen for your own list of fundamentally attractive stocks, or you could get even fancier by using some simple market timing tools that can help keep you out of bear markets altogether, thus boosting these returns considerably.
The possibilities are endless, limited only by the power of your imagination and self-confidence in pursuing the goal of trading and investing success.
By Don Pendergast of LinearJax.com
Don Pendergast has been trading/investing since 1979; since 1999, he has been developing stock, ETF, and futures trading systems using various system development platforms, including Metastock and TradeStation.


