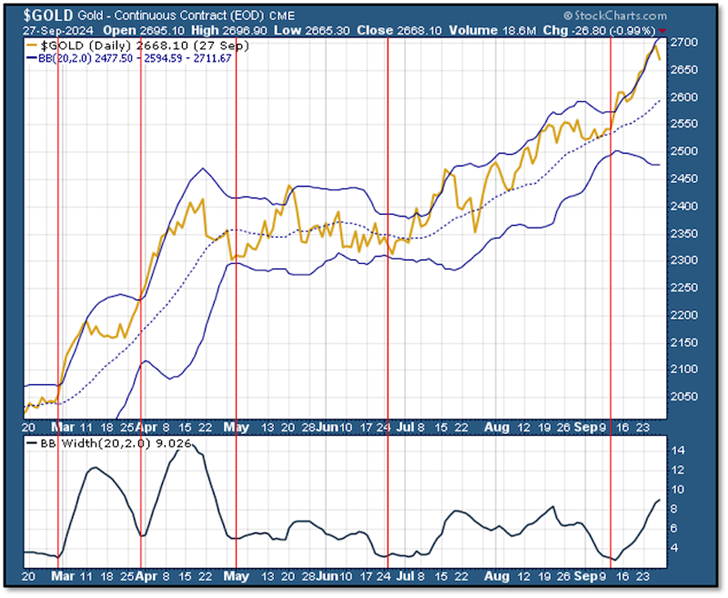
Gold just lost about $40 over a couple of sessions, after setting yet another all-time high and threatening to close above $2,700 on a spot basis. Frankly, it looks like this bout of weakness could last a while. Let’s take a look at why, suggests Brien Lundin, executive editor of Gold Newsletter.
As you may remember, in early July I shared a chart showing how, during this nascent bull market in gold, price breakouts had been reliably predicted whenever its Bollinger bands narrowed. As a bit of background, Bollinger bands are a measure of volatility, with the center line marking the 20-day moving average while the upper and lower bands typically mark two standard deviations above and below that average. When the price is near the upper band, it signals that an asset is overbought (and perhaps due for a correction), and vice versa for the lower band.
(Editor’s Note: Brien Lundin is speaking at the 2024 MoneyShow Orlando, which runs Oct. 17-19. Click HERE to register)
Another way to use this tool is to find times when, as I noted above, the bands “pinch.” This shows a period of low volatility and consolidation during an established trend, and often presages an imminent breakout, usually in the same direction as that trend.
Now, take a look at that same chart of gold and its Bollinger bands, updated for this week’s values:

As you can see, we had another chance to buy gold when the bands pinched a few weeks ago and, since then, gold has been riding the upper band higher. Now that rally has lost steam and the bands are, just barely, starting to come together again. The record of this bull market shows that the process of narrowing has so far taken anywhere from one to three weeks, so we could see some continued price weakness.
The good news is that, from a fundamental standpoint, everything seems to be turning in favor of gold. We’re in a long-term, secular bull market. And we need to be positioned for it. One of the best ways, of course, is through high-quality junior mining equities.


