Channel investing has been around since the dawn of traders, but this new application of the strategy has some interesting benefits for income investors, writes Jim Trippon of Dividend Genius.
We’ve written recently about a relatively simple way to apply a portfolio management technique to your dividend holdings, which we labeled as “keep some, sell some.” This enables a dividend investor to build and keep a core of portfolio holdings, yet not be wedded to the concept of buy and hold.
The too-rigid application of buy and hold exacerbated the disastrous results many investors had after the market plunge in the wake of the 2008-2009 financial crisis. While even in the time-honored way of buy and hold, before that method was shown to have serious problems for those who didn’t periodically monitor and clean out their holdings, investors should never have let stocks sit unwatched for months and years, but that is what many did.
With the concept of keeping some shares but perhaps selling others of even popular holdings, it is a way of actually mitigating the pain of market drops as well as locking in profits. Of course, with the proceeds from trimming your holdings from time to time, you can keep that in your investment fund and redeploy them elsewhere, or even put money back into the same stocks (more on that upcoming), or use the proceeds for any other purpose you want.
The next method of enhancing profits and protecting against the downside is related to this keep some, sell some. It’s called channeling stocks, and even though it reached a certain popularity that may have waned during these more volatile market years, it still has benefits.
Price Patterns
Channeling stocks is a method that is a mixture of many other investing and trading methods, so there’s no one precise right or wrong way to do it. There are, however, many beneficial ways to channel stocks and many wrinkles investors can use. The first thing is to understand the main concept, though.
A channel stock is one whose high and low prices travel over time in a relatively predictable pattern. That is to say that a given stock’s share price might move in a range of, for example, $30 to $50 a share over the course of a year. The share price most likely will have its ups and downs, as it doesn’t often travel in a straight line up or down through its 52-week journey (though some may do this due to unusual circumstances).
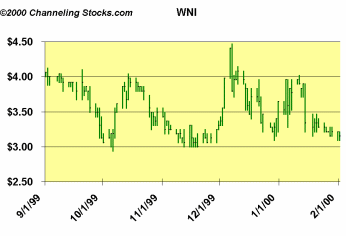
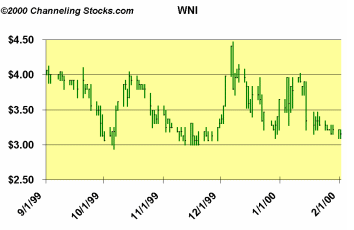
For purposes of illustration, though, to keep this simple, we present a chart below from Channelstocks.com that illustrates a stock’s channeling behavior. The stock was Schiff Nutrition (SHF).
As you can see, the share price repeats in a wave pattern within a channel of roughly $3.25 to $4.10 in the Channelstocks.com example. This is the basic concept, as they point out, that the stock price moves in a predictable wave pattern, so historically one could expect the next move for the stock price to bottom out around the $3.25 area, then begin its ascent back up into the $4.10 range. Stock channeling makes use of very basic technical or charting principles such as resistance and support.
The bottom figure of the $3.25 share price is considered support, where a line drawn between those successive lows has in every case resulted in the next move for the stock as one to the upside. In the same way, the price at $4.25 represents resistance—the upper level for the price at which it then reverses itself and travels down again.
We want to reiterate that this is an example only, and that the process isn’t always or even usually this straightforward, yet it illustrates perfectly the type of stock you want to select. Note this example from Channelingstocks.com: the next move. Shares surged back up.
Of course, if the market and stocks always behaved as in the above example, investing would be easy. But in the real world of the markets and stocks, few examples perform as ideally as the wave pattern did for Schiff shares in that time period.
What you should look for as an investor instead are relatively stable stocks, such as the blue chips that tend to have price movement that is slower and less volatile than the general market, as candidates for channeling. These are often solid dividend stocks that are prime candidates for this method.
Take Procter & Gamble (PG), a Dow bellwether and a solid dividend payer. This real-world example suggests that you can draw support lines at $61 a share and resistance at $66. Yes, in 2009 and in the summer of this year, the share-price pattern did not strictly adhere to the theory. But that’s the realistic nature of stock prices and market events, the difference between the theory and the actual practice.
You still must apply some judgment as an investor, and not strictly rely on a mechanical method, no matter how seemingly reliable. This type of pattern has a long historical record and is similar to Weiss and Lowe’s work in their book Dividends Don’t Lie, with their undervalued and overvalued chart patterns. So this methodology can work to powerfully enhance your profits.
Subscribe to Dividend Genius here...
Related Reading:
Tailoring Your Sector Strategy


